OneGlass
OpenTelemetry-native observability. Send logs, traces and metrics with standard OpenTelemetry; OneGlass stores them in your own workspace, lets you query them, maps your systems and explains what broke — for your team and for your AI agents.
Observabilidad nativa de OpenTelemetry. Enviás logs, trazas y métricas con OpenTelemetry estándar; OneGlass los guarda en tu propio workspace, te deja consultarlos, mapea tus sistemas y explica qué se rompió — para tu equipo y para tus agentes de IA.
Overview
Resumen
OneGlass is an observability platform built on OpenTelemetry. Your apps, hosts and collectors send logs, traces and metrics over standard OTLP, and your web apps send real-user sessions. Everything lands in your own isolated workspace, where you search it, chart it and get alerted on it.
OneGlass es una plataforma de observabilidad construida sobre OpenTelemetry. Tus apps, hosts y collectors mandan logs, traces y métricas por OTLP estándar, y tus apps web mandan sesiones de usuarios reales. Todo llega a tu propio workspace aislado, donde lo buscás, lo graficás y recibís alertas.
What you get
Qué tenés
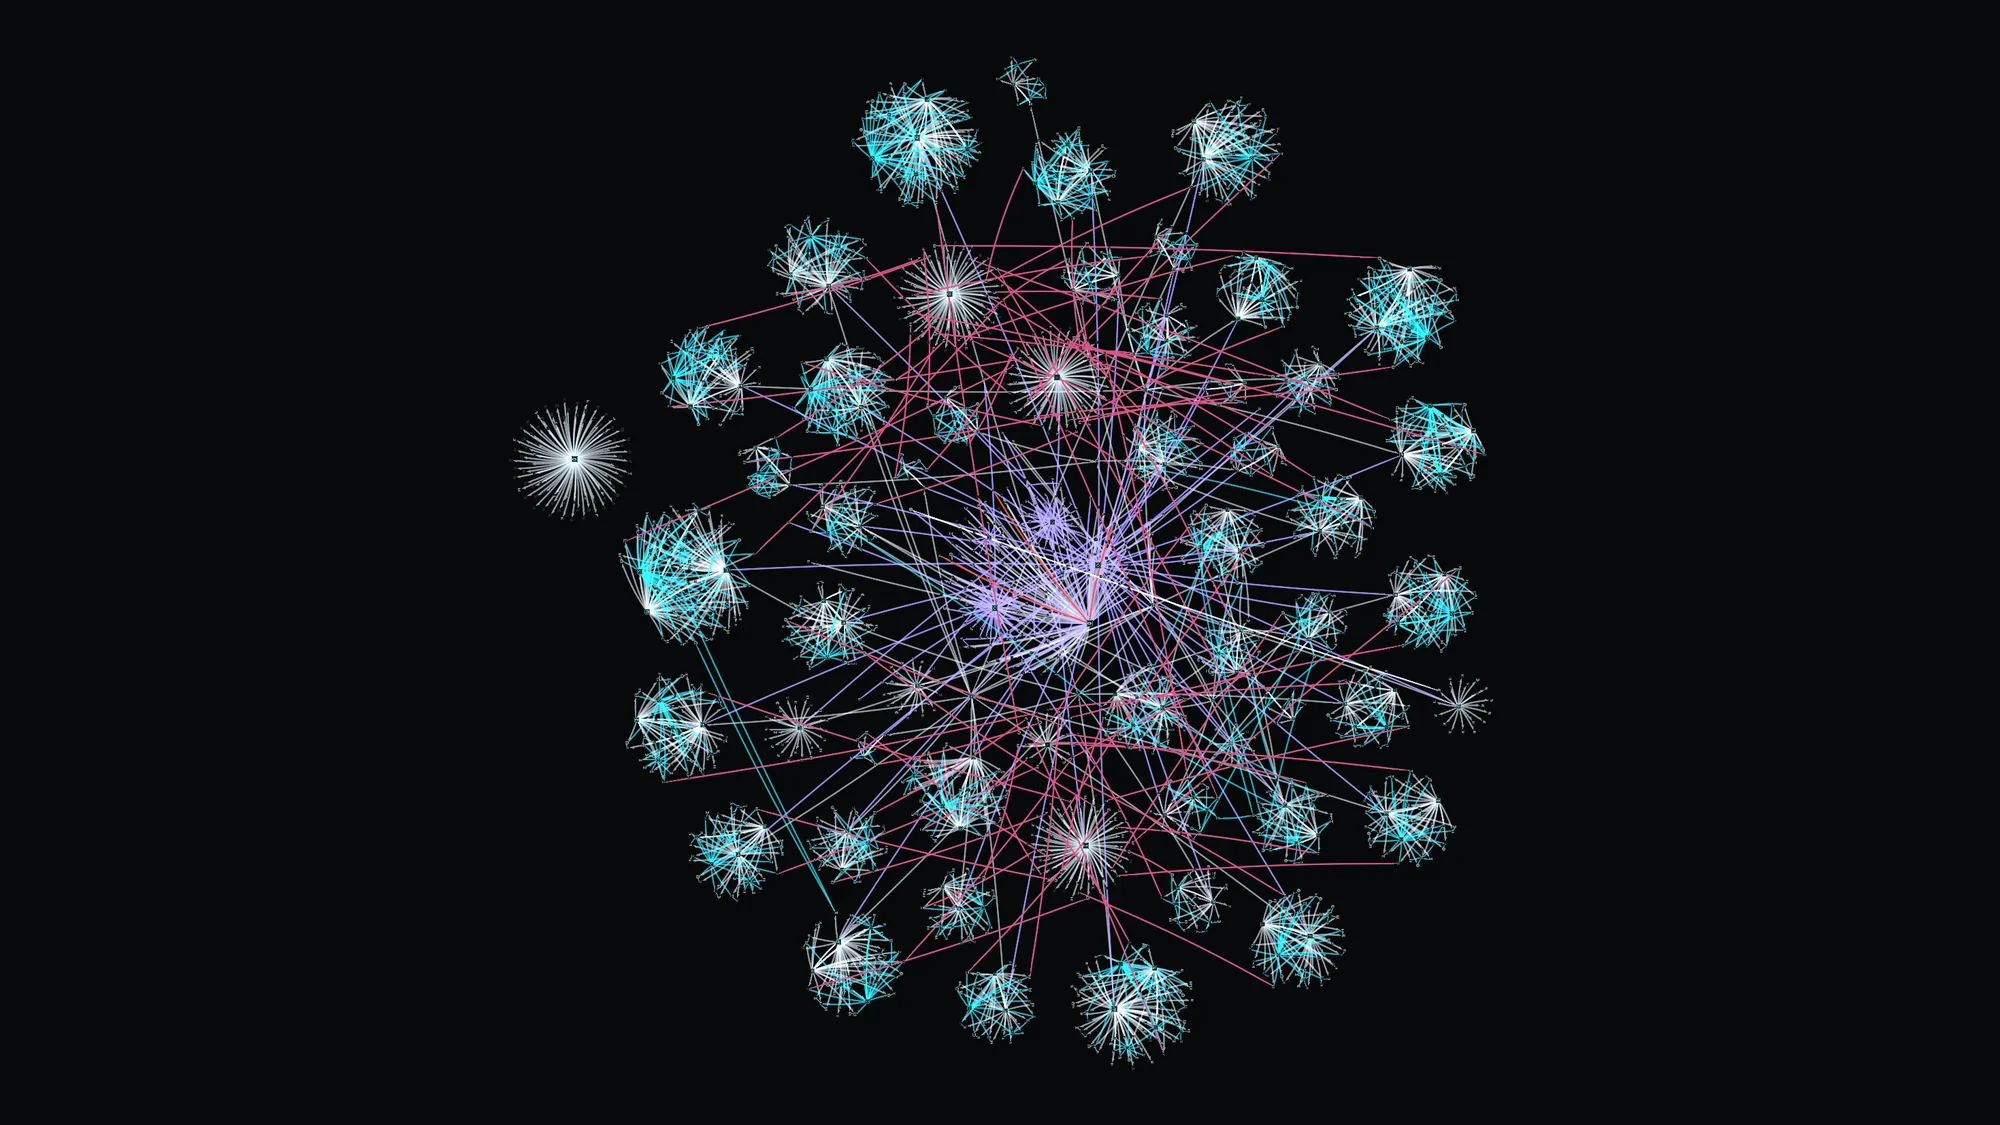
Architecture at a glance
Arquitectura de un vistazo
There are two separate paths: the data path, which carries your telemetry, and the control path, which carries agent configuration.
Hay dos caminos separados: el camino de datos, que lleva tu telemetría, y el camino de control, que lleva la configuración de los agentes.
Data path
Camino de datos
Control path
Camino de control
OneGlass agents and managed collectors connect to OneGlass Pipelines over OpAMP to report health and receive their configuration. Pipelines never sits in the data path: telemetry always goes to the ingest endpoint.
Los agentes de OneGlass y los collectors gestionados se conectan a OneGlass Pipelines por OpAMP para reportar su estado y recibir su configuración. Pipelines nunca está en el camino de datos: la telemetría siempre va al endpoint de ingesta.
Quickstart
Inicio rápido
If your app already uses OpenTelemetry, you only need three values and one config change.
Si tu app ya usa OpenTelemetry, solo necesitás tres valores y un cambio de configuración.
1 · Get your values
1 · Conseguí tus valores
An admin opens Settings › Deployment and picks Bring your own collector. It shows the ingest endpoint, your tenant ID and an ingest key, ready to copy. An admin can also create an ingest key in Settings › API Keys.
Un admin abre Configuración › Despliegue y elige Traé tu propio collector. Ahí aparecen el endpoint de ingesta, tu ID de tenant y una clave de ingesta, listos para copiar. Un admin también puede crear una clave de ingesta en Configuración › Claves API.
2 · Point your exporter at OneGlass
2 · Apuntá tu exporter a OneGlass
Set the endpoint and the two required headers on your SDK or collector. See the example in Instrument your app.
Configurá el endpoint y los dos headers obligatorios en tu SDK o collector. Mirá el ejemplo en Instrumentar tu app.
3 · See your data
3 · Mirá tus datos
Once data arrives, your service shows up in Services, and its spans and logs in Traces and Logs.
Cuando llegan los datos, tu servicio aparece en Servicios, y sus spans y logs en Trazas y Registros.
Instrument your app
Instrumentar tu app
Use the regular OpenTelemetry SDK or auto-instrumentation for your language. OneGlass only needs the exporter to point at your ingest endpoint with two headers.
Usá el SDK de OpenTelemetry o la auto-instrumentación de tu lenguaje, como siempre. OneGlass solo necesita que el exporter apunte a tu endpoint de ingesta con dos headers.
Most SDKs read the standard OpenTelemetry environment variables. For example:
La mayoría de los SDK leen las variables de entorno estándar de OpenTelemetry. Por ejemplo:
OTEL_EXPORTER_OTLP_ENDPOINT="https://ingest.oneglass.io"
OTEL_EXPORTER_OTLP_PROTOCOL="http/protobuf"
OTEL_EXPORTER_OTLP_HEADERS="Authorization=Api-Token%20<ingest-key>,X-Tenant-ID=<tenant-id>"
OTEL_SERVICE_NAME="checkout"
Use the exact endpoint, key and tenant ID shown in Settings › Deployment. %20 is the space between Api-Token and the key.
Usá exactamente el endpoint, la clave y el ID de tenant que muestra Configuración › Despliegue. %20 es el espacio entre Api-Token y la clave.
| Header | Required | If wrong |
|---|---|---|
Authorization | Yes. An ingest key, as Api-Token <key> or Bearer <key>. | 401 if missing or invalid; 403 if the key has no ingest scope. |
X-Tenant-ID | Yes. Your tenant ID. | 401 if missing or if it does not match the key. |
| Header | Obligatorio | Si está mal |
|---|---|---|
Authorization | Sí. Una clave de ingesta, como Api-Token <clave> o Bearer <clave>. | 401 si falta o no es válida; 403 si la clave no tiene el alcance de ingesta. |
X-Tenant-ID | Sí. Tu ID de tenant. | 401 si falta o si no coincide con la clave. |
Browser apps (RUM)
Apps web (RUM)
Real-user monitoring records page loads, web vitals, errors and a session replay. An admin creates the app in Settings › Applications and copies its snippet. It is one script tag that looks like this:
El monitoreo de usuarios reales registra cargas de página, web vitals, errores y un replay de la sesión. Un admin crea la app en Configuración › Aplicaciones y copia su snippet. Es un solo tag script con esta forma:
<script src="https://<workspace-host>/rcx-rum.js"
  data-rcxconfig="endpoint=https://<workspace-host>/rum/<tenant-id>/v1/logs?app=<app-id>"
  defer></script>
The snippet carries no secret, only your tenant ID and the app ID. Recording, sampling, masking and allowed origins are set per app in Settings and apply without changing the snippet. By default all text is masked. Recorded sessions appear in Sessions.
El snippet no lleva ningún secreto, solo tu ID de tenant y el ID de la app. La grabación, el muestreo, el enmascarado y los orígenes permitidos se configuran por app en Configuración y se aplican sin cambiar el snippet. Por defecto se enmascara todo el texto. Las sesiones grabadas aparecen en Sesiones.
Hosts and Kubernetes
Hosts y Kubernetes
To collect from servers and clusters, an admin generates an installer for your workspace in Settings › Deployment. The host and cluster options are:
Para recolectar desde servidores y clusters, un admin genera un instalador para tu workspace en Configuración › Despliegue. Las opciones para hosts y clusters son:
The same wizard also offers Agentless RUM (Browser) (see Browser apps) and Bring your own collector (next section).
El mismo asistente también ofrece RUM sin agente (Browser) (ver Apps web) y Traé tu propio collector (siguiente sección).
Installed agents show up in Settings › Agents, and they receive their configuration from OneGlass Pipelines.
Los agentes instalados aparecen en Configuración › Agentes y reciben su configuración desde OneGlass Pipelines.
Bring your own collector
Traé tu propio collector
If you already run an OpenTelemetry Collector, you can keep it and connect it to OneGlass. In Settings › Deployment, pick Bring your own collector and choose how much OneGlass manages:
Si ya corrés un OpenTelemetry Collector, podés seguir usándolo y conectarlo a OneGlass. En Configuración › Despliegue, elegí Traé tu propio collector y decidí cuánto gestiona OneGlass:
For Report-only and SDK-direct, the wizard fills in a ready-to-paste exporter block (HTTP or gRPC) with your endpoint and headers, a minimal collector.yaml if you need one, and a test command; Report-only also adds an OpAMP extension block. For Managed, it gives you the supervisor config and the environment variables to set. Besides the two required headers, the exporter adds x-rcx-agent-id, which identifies that collector in the Agents list.
Para Solo reporte y SDK directo, el asistente completa un bloque de exporter listo para pegar (HTTP o gRPC) con tu endpoint y tus headers, un collector.yaml mínimo si lo necesitás, y un comando de prueba; Solo reporte agrega además un bloque de extensión OpAMP. Para Gestionado, te da la config del supervisor y las variables de entorno a definir. Además de los dos headers obligatorios, el exporter agrega x-rcx-agent-id, que identifica a ese collector en la lista de Agentes.
To cut a collector off, revoke its ingest key in Settings › API Keys. Every collector using that key stops, so give a collector its own key (Create a new key in the wizard) if you may need to cut it off alone.
Para cortar un collector, revocá su clave de ingesta en Configuración › Claves API. Se cortan todos los collectors que usan esa clave, así que dale una clave propia (Create a new key en el asistente) si vas a necesitar cortarlo solo.
OpenTelemetry
OpenTelemetry
OpenTelemetry (OTel) is the open standard for producing and sending telemetry. OneGlass uses it end to end, so your instrumentation is not tied to OneGlass.
OpenTelemetry (OTel) es el estándar abierto para generar y enviar telemetría. OneGlass lo usa de punta a punta, así que tu instrumentación no queda atada a OneGlass.
| Signal | What it is | Where you see it |
|---|---|---|
| Logs | Timestamped records of events | Logs |
| Traces | Spans that follow a request across services | Traces, Services |
| Metrics | Numbers measured over time | Metrics, dashboards |
| RUM | Browser sessions, sent by the OneGlass browser agent | Sessions |
| Señal | Qué es | Dónde la ves |
|---|---|---|
| Logs | Registros de eventos con timestamp | Registros |
| Traces | Spans que siguen un request entre servicios | Trazas, Servicios |
| Métricas | Números medidos en el tiempo | Métricas, dashboards |
| RUM | Sesiones del navegador, enviadas por el agente de navegador de OneGlass | Sesiones |
Data travels over OTLP, using HTTP/protobuf or gRPC. Attributes follow the semantic conventions, such as service.name or k8s.pod.name. OneGlass uses them to build topology and connect signals, so standard names give you more out of the box. Settings › Semantic conventions shows how well your incoming data follows them.
Los datos viajan por OTLP, con HTTP/protobuf o gRPC. Los atributos siguen las convenciones semánticas, como service.name o k8s.pod.name. OneGlass las usa para armar la topología y relacionar señales, así que con nombres estándar obtenés más sin hacer nada. Configuración › Convenciones semánticas muestra qué tan bien las sigue la telemetría que te llega.
How ingestion works
Cómo funciona la ingesta
Admins manage the tenant collector's config and its routing rules in Settings › Pipeline. Each rule has a signal, an OTTL condition and a destination bucket. Rules only choose a bucket; they do not drop or mask data.
Los admins gestionan la configuración del collector del tenant y sus reglas de ruteo en Configuración › Pipeline. Cada regla tiene una señal, una condición OTTL y un bucket de destino. Las reglas solo eligen un bucket; no descartan ni enmascaran datos.
Data model and retention
Modelo de datos y retención
Each tenant's telemetry is kept in its own isolated store, organized in buckets. Admins manage them in Settings › Buckets.
La telemetría de cada tenant se guarda en su propio almacén aislado, organizada en buckets. Los admins los gestionan en Configuración › Buckets.
| Concept | What it means |
|---|---|
| Default buckets | Logs, traces, sessions and metrics each have a default bucket. An admin can change their retention. |
| Custom buckets | Extra buckets with their own retention. Routing rules decide what goes into them. |
| Retention | Set per bucket, from 1 to 3650 days. Older data is removed automatically. |
| Rollups | Metrics are also stored as 10-minute and 1-hour summaries, so long time ranges stay fast. |
| Archive | Archiving a bucket does not stop routing rules from writing to it: disable or repoint the rules that target it first. You can restore it until you purge it. It is not an export. |
| Concepto | Qué significa |
|---|---|
| Buckets por defecto | Logs, traces, sesiones y métricas tienen cada uno un bucket por defecto. Un admin puede cambiar su retención. |
| Buckets propios | Buckets extra con su propia retención. Las reglas de ruteo deciden qué entra en ellos. |
| Retención | Se define por bucket, de 1 a 3650 días. Los datos más viejos se borran solos. |
| Rollups | Las métricas también se guardan como resúmenes de 10 minutos y de 1 hora, así los rangos largos siguen siendo rápidos. |
| Archivar | Archivar un bucket no impide que las reglas de ruteo sigan escribiendo en él: primero desactivá o redirigí las reglas que apuntan a él. Lo podés restaurar mientras no lo purgues. No es una exportación. |
Logs & the query workbench
Logs y el workbench de consultas
Search logs in Signals › Logs. Pick a time range, write a query and run it (Ctrl/Cmd+Enter). You get a volume histogram, the matching records and a facet sidebar: click a value to add it as a filter.
Buscás logs en Señales › Registros. Elegí un rango de tiempo, escribí una consulta y correla (Ctrl/Cmd+Enter). Tenés un histograma de volumen, los registros que coinciden y una barra de facetas: hacé clic en un valor para sumarlo como filtro.
The same workbench is used by Logs, Traces and the Chart Explorer. Its editor has five tabs:
El mismo workbench se usa en Registros, Trazas y el Explorador de Charts. Su editor tiene cinco pestañas:
SELECT; it is translated to RCXQL as you type, and the RCXQL is what runs. JOINs, subqueries and similar constructs are rejected with a message, not approximated.SELECT; se traduce a RCXQL mientras tipeás, y lo que corre es el RCXQL. JOINs, subconsultas y construcciones similares se rechazan con un mensaje, no se aproximan.Patterns and Denoise
Patrones y Quitar ruido
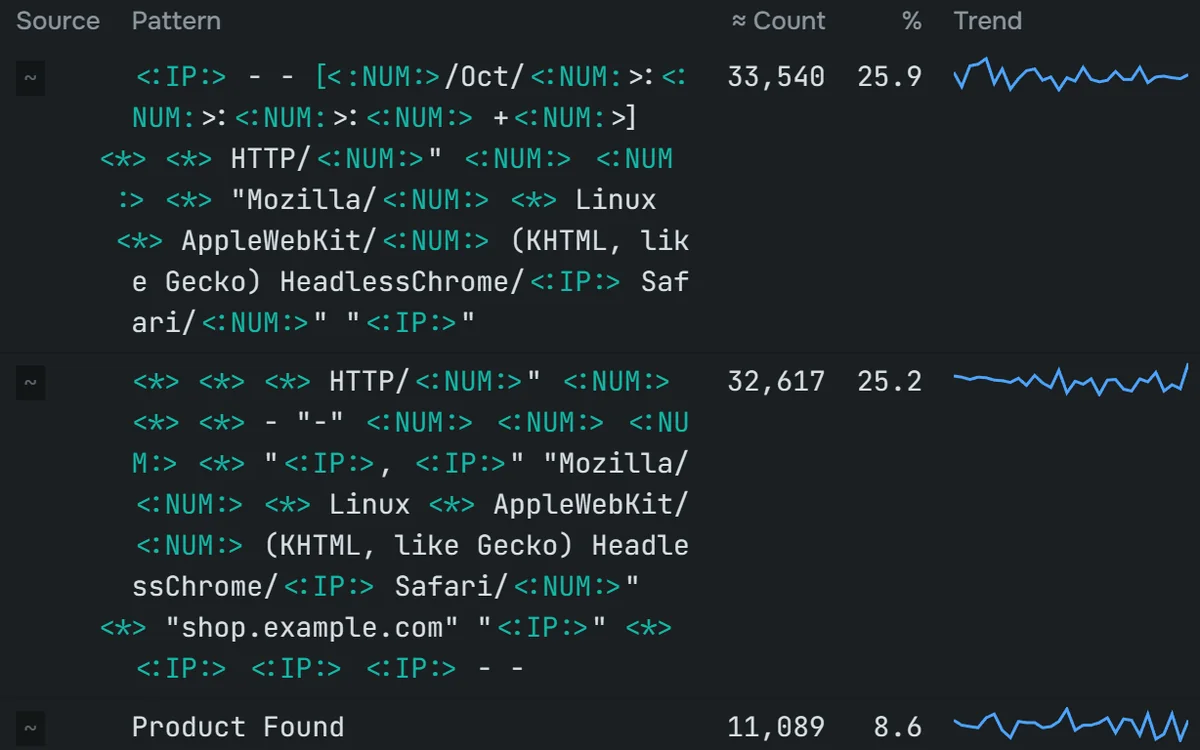
Switch from Events to Patterns to see log lines grouped into the templates behind them, each with its count. In Events, Denoise hides the dominant patterns so the unusual lines stand out; you can show any hidden pattern again.
Pasá de Eventos a Patrones para ver las líneas de log agrupadas en las plantillas que hay detrás, cada una con su cantidad. En Eventos, Quitar ruido oculta los patrones dominantes para que resalten las líneas raras; cualquier patrón oculto se puede volver a mostrar.
RCXQL
RCXQL
RCXQL is OneGlass's piped query language. One language covers logs, traces, metrics, sessions and topology. A query starts with get <entity> and each step after a | transforms the rows from the step before. Scan and result limits are applied for you.
RCXQL es el lenguaje de consultas con pipes de OneGlass. Un solo lenguaje cubre logs, trazas, métricas, sesiones y topología. Una consulta arranca con get <entidad> y cada paso después de un | transforma las filas del paso anterior. Los límites de escaneo y de resultado se aplican solos.
get logs, from: -1h
| filter service.name = "checkout" and is_error
| limit 50
You write it in the QL tab of the workbench and in dashboard and notebook panels; the same queries work over the HTTP API and the MCP execute_rcxql tool.
Lo escribís en la pestaña QL del workbench y en los paneles de dashboards y notebooks; las mismas consultas funcionan por la API HTTP y con la tool MCP execute_rcxql.
RCXQL reference
Referencia RCXQL
To see the fields of any entity, run get <entity> | describe.
Para ver los campos de cualquier entidad, corré get <entidad> | describe.
Entities
Entidades
| Entity | Rows are |
|---|---|
logs · spans | Log records · trace spans |
metrics · metrics.gauge · metrics.sum · metrics.histogram | Metric data points: gauge + sum, or one type (filter by metric.name) |
sessions | RUM sessions and events |
tpl.service · tpl.host · tpl.container · tpl.process | Topology entities |
tpl.edges · tpl.deps | Topology graph edges and service dependency call counts |
tpl.registry · tpl.entity_metrics | Entity catalog and which metrics each entity emits |
ai.events · ai.incidents · ai.baselines | Detected anomalies, incidents, baselines |
auto.runs · auto.run_logs · auto.events | Workflow runs, task logs, trigger events |
| Entidad | Las filas son |
|---|---|
logs · spans | Registros de log · spans de traza |
metrics · metrics.gauge · metrics.sum · metrics.histogram | Data points de métricas: gauge + sum, o por tipo (filtrar por metric.name) |
sessions | Sesiones y eventos de RUM |
tpl.service · tpl.host · tpl.container · tpl.process | Entidades de topología |
tpl.edges · tpl.deps | Aristas del grafo de topología y conteos de llamadas entre dependencias |
tpl.registry · tpl.entity_metrics | Catálogo de entidades y qué métricas emite cada una |
ai.events · ai.incidents · ai.baselines | Anomalías detectadas, incidentes, baselines |
auto.runs · auto.run_logs · auto.events | Ejecuciones de flujos, logs de tareas, eventos de disparo |
Steps
Pasos
| Step | What it does |
|---|---|
filter · filterOut · search | Keep or drop rows; full-text search |
fields · fieldsAdd · fieldsRename · parse | Choose, compute, rename or extract columns |
summarize … by: {…} · makeTimeseries … interval: | Aggregate; aggregate into time buckets |
sort · limit · dedup | Order, cut, de-duplicate |
join · lookup · append · expand | Combine queries; unfold arrays |
traverse · describe | Walk the topology graph; list an entity's fields |
| Paso | Qué hace |
|---|---|
filter · filterOut · search | Conserva o descarta filas; búsqueda de texto |
fields · fieldsAdd · fieldsRename · parse | Elige, calcula, renombra o extrae columnas |
summarize … by: {…} · makeTimeseries … interval: | Agrega; agrega en buckets de tiempo |
sort · limit · dedup | Ordena, recorta, de-duplica |
join · lookup · append · expand | Combina consultas; despliega arrays |
traverse · describe | Recorre el grafo de topología; lista los campos de una entidad |
Functions
Funciones
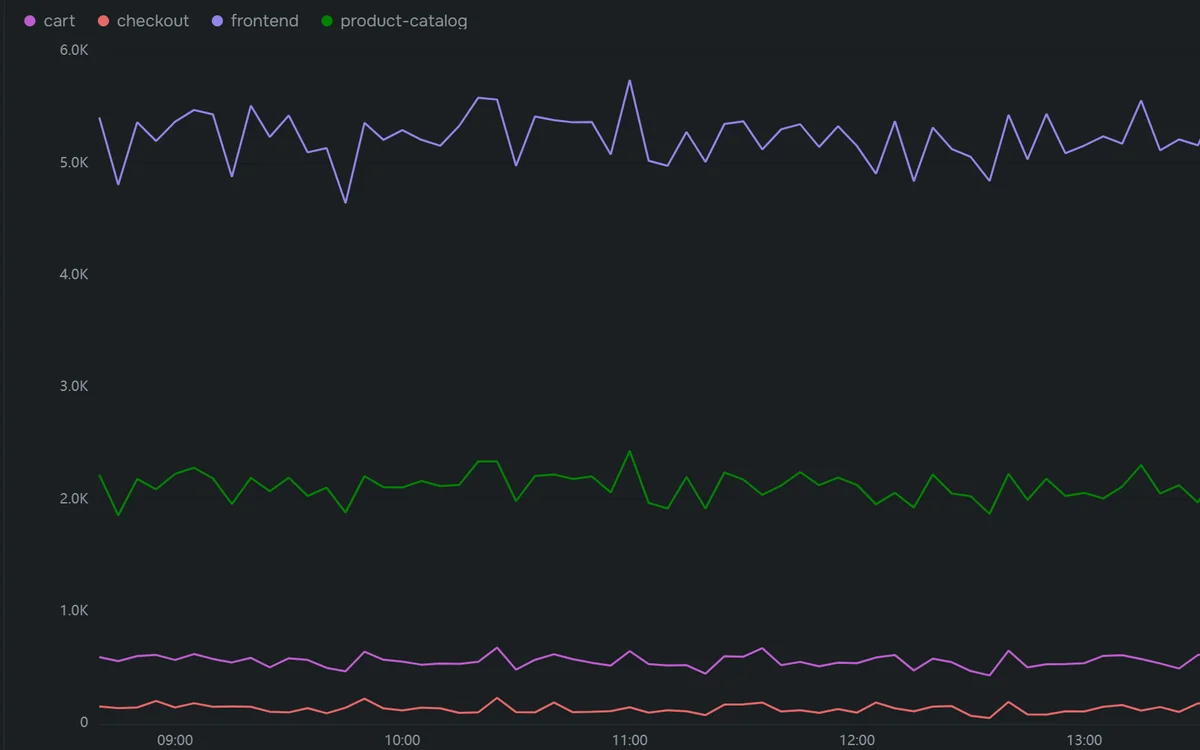
Aggregations count(), countIf, sum, avg, min, max, countDistinct; percentiles p50, p90, p95, p99, median, percentile(x, N); scalar round, abs, if, coalesce, lower, upper, concat, substring; time now(), bin(field, interval); inside makeTimeseries also delta and rate.
Agregaciones count(), countIf, sum, avg, min, max, countDistinct; percentiles p50, p90, p95, p99, median, percentile(x, N); escalares round, abs, if, coalesce, lower, upper, concat, substring; tiempo now(), bin(field, interval); dentro de makeTimeseries también delta y rate.
Examples
Ejemplos
get spans, from: -1h | summarize p95_ms = p95(duration), by: {service.name} | sort p95_ms desc | limit 10get spans, from: -1h | summarize p95_ms = p95(duration), by: {service.name} | sort p95_ms desc | limit 10get logs, from: -6h | makeTimeseries count(), by: {loglevel}, interval: 10mget logs, from: -6h | makeTimeseries count(), by: {loglevel}, interval: 10mget tpl.deps, from: -24h | summarize calls = sum(call_count), errors = sum(error_count), by: {caller, callee} | sort calls descget tpl.deps, from: -24h | summarize calls = sum(call_count), errors = sum(error_count), by: {caller, callee} | sort calls descget tpl.service, from: -1h | filter service.name = "checkout" | traverse axis: horizontal, direction: bothget tpl.service, from: -1h | filter service.name = "checkout" | traverse axis: horizontal, direction: bothMetrics
Métricas
Signals › Metrics has two tabs, Explorer (the Chart Explorer) and Registry (the Metric Registry):
Señales › Métricas tiene dos pestañas, Explorador (el Explorador de gráficos) y Registro (el Registro de Métricas):
- Chart Explorer — build a chart with the workbench (any editor tab), choose the chart type, compare with the previous period, and Save to Dashboard.
- Explorador de gráficos — armás un gráfico con el workbench (cualquier pestaña del editor), elegís el tipo de gráfico, comparás con el período anterior y usás Save to Dashboard.
- Metric Registry — the catalog of metrics you send: search by name, type or category, see which entities report each one, and open it in the Chart Explorer.
- Registro de Métricas — el catálogo de métricas que enviás: buscás por nombre, tipo o categoría, ves qué entidades reportan cada una y la abrís en el Explorador de gráficos.
Dashboards
Dashboards
In Analyze › Dashboards you create, search, tag, pin, clone, export and delete dashboards. Each panel is an RCXQL or PromQL query with one of many chart types (line, bar, table, heatmap, gauge, single value, sankey, markdown and more).
En Analizar › Tableros creás, buscás, etiquetás, fijás, clonás, exportás y borrás dashboards. Cada panel es una consulta RCXQL o PromQL con uno de muchos tipos de gráfico (línea, barras, tabla, heatmap, gauge, valor único, sankey, markdown y más).
- Import — a dashboard JSON from OneGlass, Grafana or Perses. Grafana and Perses dashboards are converted on import, and you get a report of what came across.
- Importar — un JSON de dashboard de OneGlass, Grafana o Perses. Los de Grafana y Perses se convierten al importar, y recibís un reporte de lo que pasó.
- Variables — a fixed list of values or values from a query, used inside panel queries.
- Variables — una lista fija de valores o valores salidos de una consulta, para usar en las consultas de los paneles.
- Layout — drag and resize panels, group them in collapsible rows, follow the global time range or set the dashboard's own, with auto-refresh.
- Layout — arrastrás y redimensionás paneles, los agrupás en filas colapsables, seguís el rango de tiempo global o fijás uno propio, con auto-refresh.
- Canvas panel — draw boxes, readings, labels, status dots, icons and connectors over a background image, and bind them to data.
- Panel canvas — dibujás cajas, lecturas, etiquetas, puntos de estado, íconos y conectores sobre una imagen de fondo, y los atás a datos.
- Inspect — see a panel's data, query and stats, and download the data as CSV.
- Inspeccionar — ves los datos, la consulta y las estadísticas de un panel, y bajás los datos en CSV.
Public links
Links públicos
Publish creates a read-only link to one dashboard. Anyone with the link sees its panels, refreshed automatically, and nothing else: they cannot edit, browse the platform or run other queries. The token is shown once; revoke it in Settings › API Keys.
Publicar crea un link de solo lectura a un dashboard. Quien tenga el link ve sus paneles, que se refrescan solos, y nada más: no puede editar, navegar la plataforma ni correr otras consultas. El token se muestra una sola vez; lo revocás en Configuración › Claves API.
Notebooks
Notebooks
A notebook is a page of cells for working through a question. In Analyze › Notebooks you create, open, pin, tag and delete them. A cell is either a query (RCXQL, shown as a chart or table, with its results saved) or a plain-text note. Cells can be moved, collapsed and removed.
Un notebook es una página de celdas para ir resolviendo una pregunta. En Analizar › Cuadernos los creás, abrís, fijás, etiquetás y borrás. Una celda es una consulta (RCXQL, como gráfico o tabla, con sus resultados guardados) o una nota de texto. Las celdas se pueden mover, colapsar y quitar.
Traces
Trazas
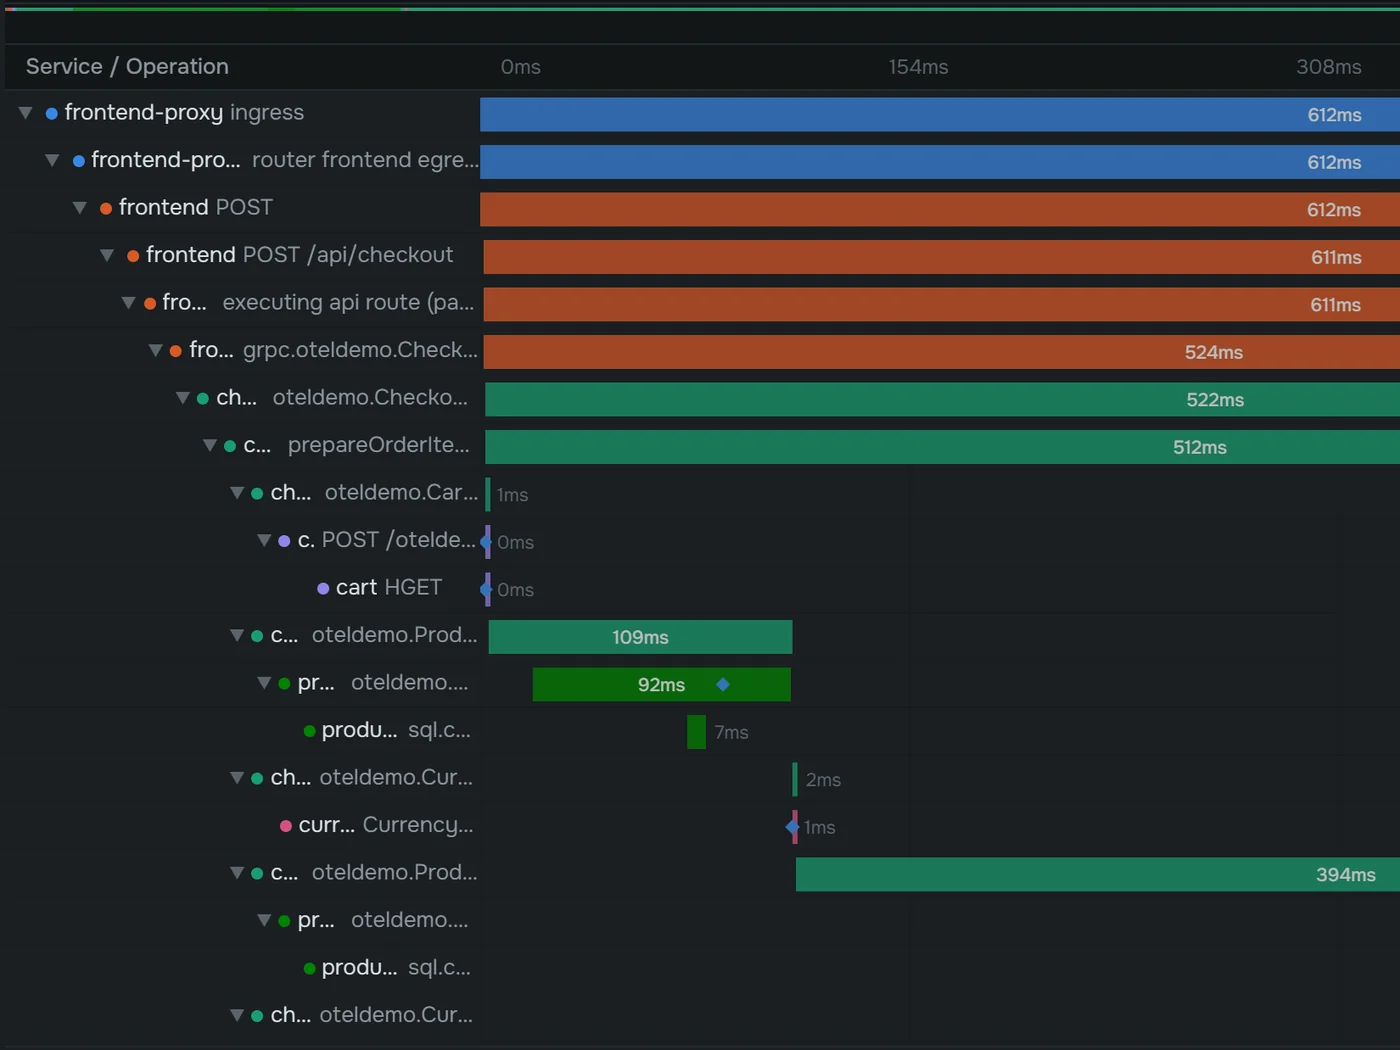
Search spans in Signals › Traces with the same workbench as Logs, plus a duration scatter to spot slow requests. Open a trace to see it as:
Buscás spans en Señales › Trazas con el mismo workbench que Registros, más un scatter de duración para encontrar requests lentos. Abrí una traza para verla como:
- Waterfall and Flamegraph — where the time went.
- Waterfall y Flamegraph — en qué se fue el tiempo.
- Service Graph — the services this trace touched.
- Service Graph — los servicios que tocó esta traza.
- Raw Spans and Infrastructure — every span as a table row (service, name, duration, status, IDs, time), and CPU, memory and disk for the Kubernetes pod and node the trace ran on.
- Raw Spans e Infrastructure — cada span como fila de una tabla (servicio, nombre, duración, estado, IDs, hora), y CPU, memoria y disco del pod y el nodo de Kubernetes donde corrió la traza.
- Conversation — the model messages, only for traces with LLM spans.
- Conversation — los mensajes con el modelo, solo en trazas con spans de LLM.
All logs of this trace jumps to the trace's logs. Spans are standard OpenTelemetry and can be queried with get spans.
Todos los logs de esta traza te lleva a los logs de la traza. Los spans son OpenTelemetry estándar y se consultan con get spans.
Services & databases
Servicios y bases de datos
Both pages are built from your traces and are read-only.
Las dos páginas salen de tus trazas y son de solo lectura.
- Applications › Services — every service as cards, a table or a map. A service's page shows its health, golden-signal charts, a dependency map, its slowest endpoints (each opens its traces), recent logs and traces, and the hosts or pods it runs on.
- Aplicaciones › Servicios — cada servicio como tarjetas, tabla o mapa. La página de un servicio muestra su salud, gráficos de golden signals, un mapa de dependencias, sus endpoints más lentos (cada uno abre sus trazas), logs y trazas recientes, y los hosts o pods donde corre.
- Applications › Services › Databases — one card per database system. Its page shows throughput, errors and latency, operations ranked by p95, and the slowest queries.
- Aplicaciones › Servicios › Bases de Datos — una tarjeta por sistema de base de datos. Su página muestra throughput, errores y latencia, operaciones ordenadas por p95 y las consultas más lentas.
Frontend apps & sessions
Apps de frontend y sesiones
Real-user monitoring (RUM) records what happens in your users' browsers. An admin registers each web app in Settings › Applications, which also gives the snippet to add to the page.
El monitoreo de usuario real (RUM) registra lo que pasa en el navegador de tus usuarios. Un admin registra cada app web en Configuración › Aplicaciones, que también te da el snippet para agregar a la página.
- Applications › Frontend › Apps — one card per app. An app's page has its sessions, errors, user actions and zones, with Web Vitals, devices and resources alongside.
- Aplicaciones › Frontend › Aplicaciones — una tarjeta por app. La página de una app tiene sus sesiones, errores, acciones de usuario y zonas, con Web Vitals, dispositivos y recursos al costado.
- Sessions — the list of sessions, real users or synthetic runs. The replay player marks errors, rage clicks, dead clicks and failed requests, can skip idle time, and plays the browser trace waterfall on the same timeline.
- Sesiones — la lista de sesiones, de usuarios reales o de corridas sintéticas. El reproductor marca errores, rage clicks, dead clicks y requests fallidos, puede saltear el tiempo quieto y reproduce la cascada de trazas del navegador en la misma línea de tiempo.
Beacons from an unregistered or disabled app, or from an origin not on the app's allowed origins, are rejected. Admins review them under Denied senders and can allow the origin, register it as an app, re-enable a disabled app, or dismiss it.
Se rechazan los beacons de una app no registrada o deshabilitada, o de un origen fuera de los orígenes permitidos de la app. Los admins los revisan en Remitentes rechazados y pueden permitir el origen, registrarlo como app, reactivar una app deshabilitada o descartarlo.
Issues (Beta)
Errores (Issues, Beta)
Applications › Frontend › Apps › Issues groups every distinct error into one row: browser errors from RUM and backend errors from spans and logs. The same list is also a tab on each app.
Aplicaciones › Frontend › Aplicaciones › Errores agrupa cada error distinto en una fila: errores de navegador desde RUM y errores de backend desde spans y logs. La misma lista también es una pestaña en cada app.
- See — how often it happens, first and last seen, affected sessions, and the newest stack trace.
- Ver — con qué frecuencia pasa, primera y última vez, sesiones afectadas y el stack trace más reciente.
- Triage — set an owner, resolve, ignore or reopen. A resolved error that comes back is marked REGRESSED.
- Triage — asignás un responsable, resolvés, ignorás o reabrís. Un error resuelto que vuelve queda como REGRESSED.
If an admin connects GitHub Issues in Settings › Integrations, you can open a bug from an issue or link an existing one; resolving or ignoring the issue closes the ticket (on by default), and reopening the issue reopens it.
Si un admin conecta GitHub Issues en Configuración › Integraciones, podés abrir un bug desde un issue o vincular uno existente; resolver o ignorar el issue cierra el ticket (activado por defecto), y reabrir el issue lo reabre.
Synthetic monitoring
Monitoreo sintético
Synthetic monitors check your endpoints and user journeys on a schedule, so you find out about an outage before your users do. See them in Applications › Frontend › Synthetics: state, availability per location, latency trend and its most recent runs (up to 500). Creating and editing monitors is for admins.
Los monitores sintéticos chequean tus endpoints y recorridos de usuario de forma programada, así te enterás de una caída antes que tus usuarios. Los ves en Aplicaciones › Frontend › Synthetics: estado, disponibilidad por ubicación, tendencia de latencia y sus ejecuciones más recientes (hasta 500). Crear y editar monitores es para admins.
Intervals are 30 s, 1 min, 5 min or 15 min (Browser monitors: 1, 5 or 15 min). Checks run from locations: your own collectors installed with the synthetic role (listed in Settings › Collectors & roles), or OneGlass Cloud (Beta) for public URLs when your platform offers it.
Los intervalos son 30 s, 1 min, 5 min o 15 min (los monitores Browser: 1, 5 o 15 min). Los chequeos corren desde ubicaciones: tus propios collectors instalados con el rol synthetic (listados en Configuración › Colectores y roles), u OneGlass Cloud (Beta) para URLs públicas cuando tu plataforma lo ofrece.
AI agents
Agentes de IA
Applications › AI Agents shows your AI agents, their model calls and the tools they use, built from the spans your AI apps already send, all on one page. It reads the OpenTelemetry GenAI conventions (gen_ai.*), so agents that use them show up with no extra setup.
Aplicaciones › Agentes de IA muestra tus agentes de IA, sus llamadas al modelo y las tools que usan, a partir de los spans que tus apps de IA ya envían, todo en una sola página. Lee las convenciones GenAI de OpenTelemetry (gen_ai.*), así que los agentes que las usan aparecen sin configuración extra.
- At the top — a summary: whether the model is answering, tokens, and agents that need attention; when the model is down, failed calls grouped by reason.
- Arriba — un resumen: si el modelo está respondiendo, los tokens y los agentes que requieren atención; si el modelo está caído, las llamadas fallidas agrupadas por motivo.
- Who calls what — a map of models, agents and tools, or the same data as tables.
- Quién llama a qué — un mapa de modelos, agentes y tools, o lo mismo como tablas.
- Conversations — shown when runs share a conversation.
- Conversaciones — aparece cuando hay corridas de una misma conversación.
- Runs — open a run to see what it was asked, how it ended, and each step with its tool, arguments and result.
- Corridas — abrí una para ver qué se le preguntó, cómo terminó y cada paso con su tool, argumentos y resultado.
- Explore runs — a button in Runs that opens an editable RCXQL query over the runs.
- Explorar corridas — un botón en Corridas que abre una consulta RCXQL editable sobre las corridas.
| Attribute | Used for |
|---|---|
gen_ai.operation.name | Required. chat, execute_tool or invoke_agent. |
gen_ai.request.model · gen_ai.provider.name | Model and provider. |
gen_ai.agent.name · gen_ai.tool.name | Agent and tool. |
gen_ai.usage.input_tokens · gen_ai.usage.output_tokens | Tokens. |
Span status Error | Marks a failed call. |
| Atributo | Para qué se usa |
|---|---|
gen_ai.operation.name | Obligatorio. chat, execute_tool o invoke_agent. |
gen_ai.request.model · gen_ai.provider.name | Modelo y proveedor. |
gen_ai.agent.name · gen_ai.tool.name | Agente y tool. |
gen_ai.usage.input_tokens · gen_ai.usage.output_tokens | Tokens. |
Estado del span Error | Marca una llamada fallida. |
Hosts, containers & processes
Hosts, contenedores y procesos
Everything that reports host telemetry shows up under Infrastructure › Hosts. Search, filter by tag, sort, and switch between cards and a table. Open a host for its tabs: Overview, Metrics, Processes, Containers, Compatibility, Traces, Logs, Events and Properties.
Todo lo que manda telemetría de host aparece en Infrastructure › Hosts. Buscás, filtrás por tag, ordenás y alternás entre tarjetas y tabla. Abrí un host para ver sus pestañas: Overview, Metrics, Processes, Containers, Compatibility, Traces, Logs, Events y Properties.
Containers and Processes have their own lists with a detail view (overview, logs, traces, events, properties). The process list hides operating-system noise unless you choose Show all.
Containers y Processes tienen sus propias listas con una vista de detalle (overview, logs, traces, eventos, propiedades). La lista de procesos oculta el ruido del sistema operativo salvo que elijas Show all.
Kubernetes
Kubernetes
The Kubernetes page shows your clusters from the standard OpenTelemetry Kubernetes data. The left nav has Overview, Optimized, Cluster, Node, Namespace, Workload (with Pod and Container), Network (Service) and Storage (PV and PVC). Filter by squad or turn on Only problems.
La página Kubernetes muestra tus clusters a partir de los datos estándar de Kubernetes de OpenTelemetry. El menú izquierdo tiene Overview, Optimized, Cluster, Node, Namespace, Workload (con Pod y Container), Network (Service) y Storage (PV y PVC). Filtrás por squad o activás Only problems.
Click any object to open its detail panel with its utilization, events and info. For a workload you also get Ownership, Right-size and Standard, a set of eight spec checks.
Hacé clic en cualquier objeto para abrir su panel de detalle con su utilización, eventos e info. En un workload además tenés Ownership, Right-size y Standard, un conjunto de ocho chequeos de spec.
Kubernetes: Optimized view
Kubernetes: vista Optimized
Kubernetes › Optimized (/kubernetes?view=optimized) helps you right-size workloads. It compares each workload's CPU and memory requests with its own peak usage over the last 24 hours. The suggested request is that peak plus 30% headroom.
Kubernetes › Optimized (/kubernetes?view=optimized) te ayuda a dimensionar bien los workloads. Compara los requests de CPU y memoria de cada workload con su propio pico de uso de las últimas 24 horas. El request sugerido es ese pico más un 30% de margen.
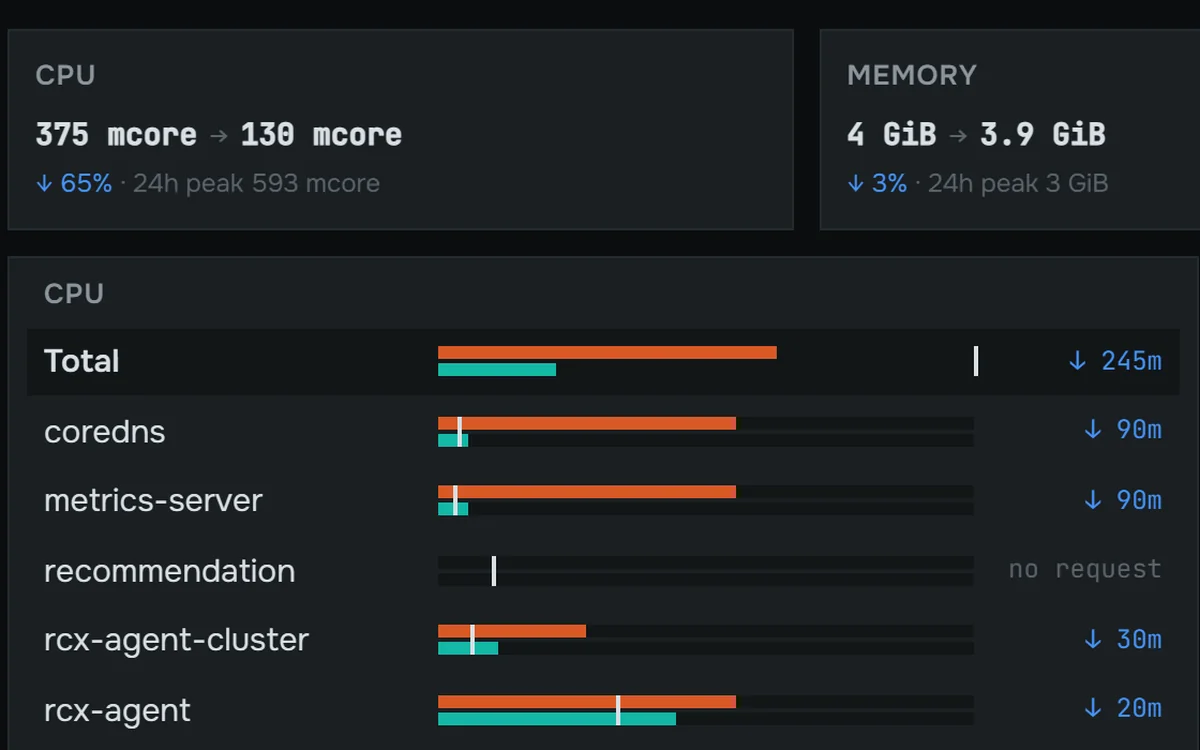
- ↓ (lower): the peak stays well under the request, so you can reserve less.
- ↓ (lower): el pico queda bien por debajo del request, así que podés reservar menos.
- ↑ (need more): the peak reached or passed the request.
- ↑ (need more): el pico llegó o pasó el request.
- ok: the peak is under the request, and the request is already at or below the peak plus 30%, so there is nothing to lower.
- ok: el pico queda por debajo del request y el request ya está en el pico más el 30% o por debajo, así que no hay nada para bajar.
- Focus: click a row for the workload's 24h chart and, when it needs a change, one sentence explaining why.
- Focus: hacé clic en una fila para ver el gráfico de 24 h del workload y, si necesita un cambio, una frase que explica por qué.
Network devices
Dispositivos de red
Infrastructure › Network & virtualization › Network devices lists your switches, routers and firewalls, worst first: address, poller, profiles, interfaces and last poll.
Infrastructure › Network & virtualization › Network devices lista tus switches, routers y firewalls, los peores primero: dirección, poller, perfiles, interfaces y último poll.
Admins add a device with a short wizard (Device, Access, Collect, Review). A device is SNMP (v1, v2c or v3) or FortiGate (API token). The credential is saved encrypted in CredStore. You choose how it is collected: pinned to one collector, balanced across a pool, or external (the data arrives over OTLP and nothing polls it).
Los admins agregan un dispositivo con un asistente corto (Device, Access, Collect, Review). Un dispositivo es SNMP (v1, v2c o v3) o FortiGate (token de API). La credencial se guarda cifrada en CredStore. Elegís cómo se recolecta: fijo a un collector, balanceado en un pool, o externo (los datos llegan por OTLP y nadie lo consulta).
For an SNMP device the detail page shows health, interfaces, topology neighbours (with the topology add-on) and syslog (when enabled). A FortiGate shows health, interfaces, HA, BGP, routes, ARP, licenses and more. You can add a faceplate photo of the device and print a QR label for the device that opens its ports on a phone (or link the QR it already has).
Para un dispositivo SNMP la página de detalle muestra salud, interfaces, vecinos de topología (con el add-on de topología) y syslog (si está activado). Un FortiGate muestra salud, interfaces, HA, BGP, rutas, ARP, licencias y más. Podés cargar una foto del frente del equipo e imprimir una etiqueta QR del equipo que abre sus puertos en el celular (o vincular el QR que ya tiene).
Hypervisors (vSphere)
Hipervisores (vSphere)
Infrastructure › Network & virtualization › Hypervisors shows your VMware estate as a tree: vCenter, datacenter, cluster, ESXi host, VM. Tabs cover overview, hosts, VMs, datastores, resource pools and a map.
Infrastructure › Network & virtualization › Hypervisors muestra tu entorno VMware como un árbol: vCenter, datacenter, cluster, host ESXi, VM. Las pestañas cubren overview, hosts, VMs, datastores, resource pools y un mapa.
Admins add a vCenter with a wizard: address, user and credential, TLS, the collector or pool that polls it, and the interval.
Los admins agregan un vCenter con un asistente: dirección, usuario y credencial, TLS, el collector o pool que lo consulta y el intervalo.
Topology
Topología
Topology draws your estate as one map, built from your telemetry: network devices, hypervisors, hosts, containers, Kubernetes objects, processes and services. Nothing to draw by hand.
Topology dibuja tu entorno en un solo mapa, armado desde tu telemetría: dispositivos de red, hipervisores, hosts, contenedores, objetos de Kubernetes, procesos y servicios. No hay nada que dibujar a mano.
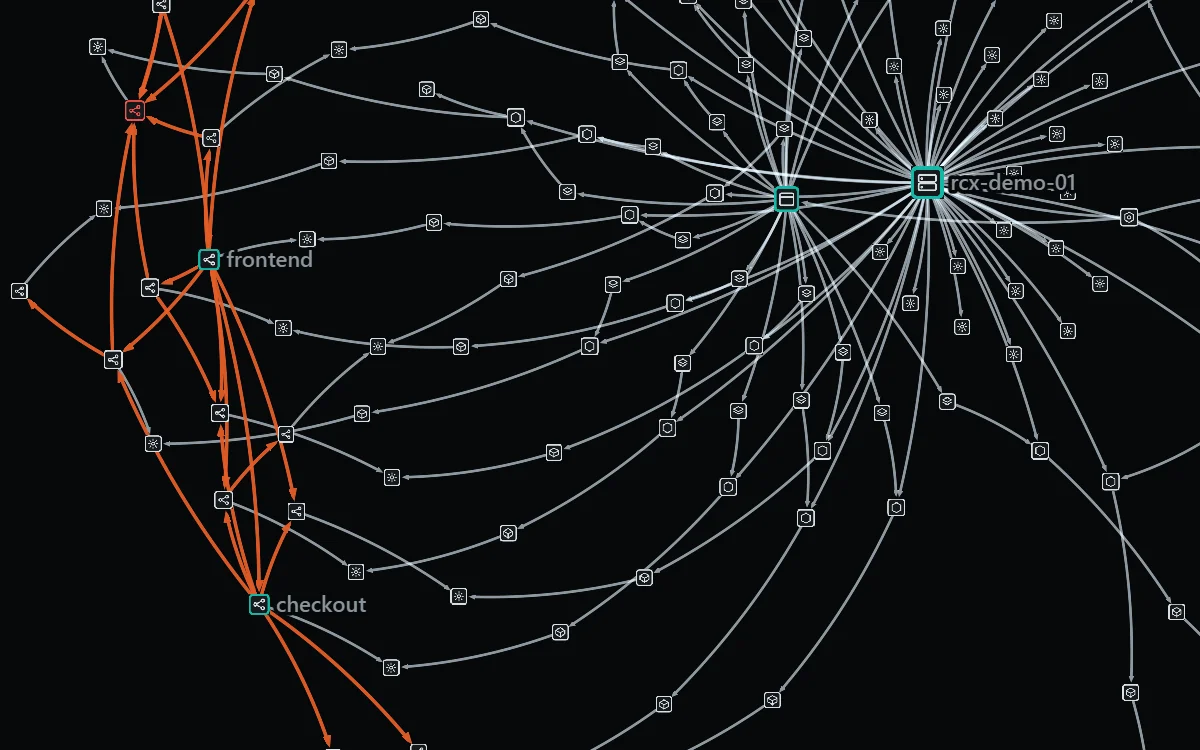
- Views: full topology, physical, physical only (just cables and what they connect), or services only.
- Vistas: topología completa, física, solo física (solo cables y lo que conectan), o solo servicios.
- Find: search, filter by kind, isolate a node.
- Buscar: búsqueda, filtro por tipo, aislar un nodo.
- Node popup: jump to its page, traces or logs.
- Popup del nodo: saltás a su página, traces o logs.
- History (Beta): replay the map over time and compare any moment with the start of the range.
- History (Beta): reproducí el mapa en el tiempo y compará cualquier momento con el inicio del rango.
Resilience
Resiliencia
Resilience shows the single points of failure in your topology: parts with no spare. Ranked tables cover the network fabric, hypervisors and Kubernetes nodes. Open one to see its blast radius, what it carries and whether anything backs it up.
Resilience muestra los puntos únicos de falla de tu topología: piezas sin repuesto. Tablas ordenadas cubren la red, los hipervisores y los nodos de Kubernetes. Abrí uno para ver su radio de impacto, qué lleva y si hay algo que lo respalde.
Simulate a failure (Beta) lets you unplug a switch or a single cable and see which hypervisor hosts and guests lose their path. Nothing is touched for real, and you can share the simulation as a link.
Simulate a failure (Beta) te deja desenchufar un switch o un solo cable y ver qué hosts de hipervisor y qué guests pierden su camino. No se toca nada de verdad, y podés compartir la simulación con un link.
Business Telemetry
Business Telemetry
Business Telemetry (Beta) lets you draw a business flow, like "customer login" or "card payment", as a map of boxes. Each box turns green, yellow or red from live data, and grey when it has no state.
Business Telemetry (Beta) te deja dibujar un flujo de negocio, como "login de clientes" o "pago con tarjeta", como un mapa de cajas. Cada caja se pone verde, amarilla o roja con datos en vivo, y gris cuando no tiene estado.
You choose what colors each box:
Vos elegís qué colorea cada caja:
- Entity: the health of one or more services or hosts.
- Entidad: la salud de uno o varios servicios o hosts.
- Guided: error rate, p95 latency, log errors or a metric threshold, with your own limits.
- Guiada: tasa de error, latencia p95, errores en logs o un umbral de métrica, con tus propios límites.
- Advanced: your own RCXQL query; Test shows the result before you save.
- Avanzado: tu propia consulta RCXQL; Probar te muestra el resultado antes de guardar.
- Another map: the box shows that map's state and opens it.
- Otro mapa: la caja muestra el estado de ese mapa y lo abre.
Click a box's status dot to see why it has that color. Maps save automatically, keep versions you can restore, and can be locked, exported and imported as JSON, or shown on a dashboard as a panel.
Hacé clic en el punto de estado de una caja para ver por qué tiene ese color. Los mapas se guardan solos, guardan versiones que podés restaurar, y se pueden bloquear, exportar e importar como JSON, o mostrar en un dashboard como panel.
Problems & root cause
Problemas y causa raíz
Detectors raise incidents. The problem engine groups related incidents along your topology into one problem and names its likely root. You find both under Problems in the menu.
Los detectores levantan incidentes. El motor de problemas agrupa los incidentes relacionados a lo largo de tu topología en un solo problema y señala su raíz probable. Encontrás ambos en Problems, en el menú.
- Problems tab: open one to see the root-cause tree with a confidence score, its member incidents and evidence, and what the engine rejected.
- Pestaña Problems: abrí uno para ver el árbol de causa raíz con un puntaje de confianza, sus incidentes miembro con la evidencia, y lo que el motor descartó.
- Incidents tab: filter by state and severity. The detail shows the signal against its threshold and a state timeline.
- Pestaña Incidents: filtrás por estado y severidad. El detalle muestra la señal contra su umbral y una línea de tiempo de estados.
OneGlass ships 50+ built-in detectors. Admins turn them on or off and tune them in Settings › Detectors, write custom ones there, and mute noise in Settings › Silences.
OneGlass trae más de 50 detectores incluidos. Los admins los prenden, apagan y ajustan en Settings › Detectors, crean los propios ahí mismo, y silencian ruido en Settings › Silences.
Notifications & integrations
Notificaciones e integraciones
Admins set up delivery targets, called channels, in Settings › Integrations. There are three kinds:
Los admins configuran los destinos de envío, llamados canales, en Settings › Integrations. Hay tres tipos:
Channels don't send anything on their own. A workflow sends to them with a Send email, Send message (webhook) or Send WhatsApp step, for example when an incident opens. See Automations.
Los canales no envían nada por sí solos. Un workflow les manda con un paso Send email, Send message (webhook) o Send WhatsApp, por ejemplo cuando se abre un incidente. Mirá Automatizaciones.
The same tab connects GitHub Issues as the bug tracker for Issues.
La misma pestaña conecta GitHub Issues como bug tracker para Issues.
Automations (Automatron)
Automatizaciones (Automatron)
Automations runs workflows: a trigger, then a chain of steps. Create, enable, disable and delete them in the Workflows tab, and build each one in a visual editor or as YAML.
Automations corre workflows: un disparador y después una cadena de pasos. Los creás, activás, desactivás y borrás en la pestaña Workflows, y armás cada uno en un editor visual o como YAML.
| Trigger | Starts the workflow when… |
|---|---|
| Invoke / Webhook | A signal arrives and matches your expression. Incidents opening and resolving arrive as signals, and the editor gives you an invoke URL for outside calls. |
| Schedule | A cron expression fires. |
| Query | An RCXQL query meets your condition. |
| Manual | Someone runs it on demand. |
| Disparador | Arranca el workflow cuando… |
|---|---|
| Invoke / Webhook | Llega una señal que cumple tu expresión. Los incidentes que se abren y se resuelven llegan como señales, y el editor te da una URL de invocación para llamadas de afuera. |
| Schedule | Se cumple una expresión cron. |
| Query | Una consulta RCXQL cumple tu condición. |
| Manual | Alguien lo corre a demanda. |
Steps come from the task catalog: RCXQL query, HTTP request, webhook, email and WhatsApp sends, a script, console log, and control steps (log, halt, feedback).
Los pasos salen del catálogo de tareas: consulta RCXQL, request HTTP, envíos por webhook, email y WhatsApp, un script, console log y pasos de control (log, halt, feedback).
The Runs tab lists the latest 50 runs; open one to see its step graph and logs. The Signals tab lets you send a test signal.
La pestaña Runs lista las últimas 50 ejecuciones; abrí una para ver su grafo de pasos y sus logs. La pestaña Signals te deja mandar una señal de prueba.
Security view
Vista de seguridad
The Security page gathers security signals that already reach OneGlass: a row of KPIs, a card per source and a feed of security incidents.
La página Security junta las señales de seguridad que ya llegan a OneGlass: una fila de KPIs, una tarjeta por fuente y un feed de incidentes de seguridad.
- Runtime (Falco): rule events by ATT&CK technique and by rule, with each rule's priority.
- Runtime (Falco): eventos de reglas por técnica ATT&CK y por regla, con la prioridad de cada una.
- Supply chain: vulnerability scans your CI pipelines send as logs.
- Supply chain: escaneos de vulnerabilidades que tus pipelines de CI mandan como logs.
- Attack surface: sensitive ports open on all interfaces.
- Attack surface: puertos sensibles abiertos en todas las interfaces.
- Edge: sources hitting your proxy with 401, 403 or 404.
- Edge: orígenes que golpean tu proxy con 401, 403 o 404.
Every panel is an RCXQL query. Admins can edit it to match their data, preview it, and reset it.
Cada panel es una consulta RCXQL. Los admins la pueden editar para que coincida con sus datos, previsualizarla y volver a la original.
Delivery
Delivery
Delivery (Beta) shows how your Kubernetes deploys go, over 7, 30 or 90 days. You can search by workload. It is read-only.
Delivery (Beta) muestra cómo vienen tus deploys en Kubernetes, en 7, 30 o 90 días. Podés buscar por workload. Es de solo lectura.
- Overview: deploy frequency, failure rate, a timeline and a breakdown by workload.
- Overview: frecuencia de deploys, tasa de fallas, una línea de tiempo y el detalle por workload.
- Deploys: each rollout's outcome and its impact, before and after.
- Deploys: el resultado de cada rollout y su impacto, antes y después.
- Running: what runs right now.
- Running: lo que corre en este momento.
MCP & Skills
MCP y Skills
Every workspace serves a Model Context Protocol (MCP) endpoint. Any MCP client — Claude, Cursor or your own agent — can read your telemetry, incidents and topology through it. Nothing to enable: you only need an API key.
Cada workspace sirve un endpoint de Model Context Protocol (MCP). Cualquier cliente MCP — Claude, Cursor o tu propio agente — puede leer tu telemetría, tus incidentes y tu topología a través de él. No hay nada que activar: solo necesitás una clave de API.
Connect a client
Conectar un cliente
Create a key with the api.read scope in Settings → API Keys (any member can). The endpoint is POST /mcp on your workspace host (MCP Streamable HTTP), with the key as a Bearer token:
Creá una clave con el scope api.read en Settings → API Keys (cualquier miembro puede). El endpoint es POST /mcp en el host de tu workspace (MCP Streamable HTTP), con la clave como token Bearer:
{
  "mcpServers": {
    "oneglass": {
      "type": "http",
      "url": "https://<your-workspace-host>/mcp",
      "headers": { "Authorization": "Bearer <your-api-key>" }
    }
  }
}
On connect the agent receives a short RCXQL primer.
Al conectarse, el agente recibe una guía corta de RCXQL.
The 15 tools
Las 15 tools
| Tool | What it does |
|---|---|
execute_rcxql | Runs an RCXQL query (100 rows by default, 1,000 max). |
list_entities | Lists the entities RCXQL can query. |
open_incidents | Incidents open right now. |
list_problems | Recent incidents, open and resolved. |
get_problem | The full history of one incident. |
entity_rca_history | Root-cause analyses already written for an entity. |
find_entity | Finds hosts, services, containers and processes by name. |
service_health | Traffic, errors and latency of a service, plus its dependencies. |
k8s_events | Recent Kubernetes events. |
recent_changes | Recent rollouts, rescales and version changes. |
log_pattern | Groups logs into patterns with counts. |
list_baselines | Which entity/metric pairs have a learned baseline. |
list_documents | Finds notebooks and dashboards by title. |
list_business_maps | Lists Business Telemetry maps and their last verdict. |
business_status | Evaluates one map and explains every box that is not OK. |
| Tool | Qué hace |
|---|---|
execute_rcxql | Ejecuta una consulta RCXQL (100 filas por defecto, 1.000 como máximo). |
list_entities | Lista las entidades que RCXQL puede consultar. |
open_incidents | Los incidentes abiertos ahora. |
list_problems | Incidentes recientes, abiertos y resueltos. |
get_problem | El historial completo de un incidente. |
entity_rca_history | Los análisis de causa raíz ya escritos para una entidad. |
find_entity | Busca hosts, servicios, contenedores y procesos por nombre. |
service_health | Tráfico, errores y latencia de un servicio, más sus dependencias. |
k8s_events | Eventos recientes de Kubernetes. |
recent_changes | Rollouts, reescalados y cambios de versión recientes. |
log_pattern | Agrupa los logs en patrones con sus conteos. |
list_baselines | Qué pares entidad/métrica tienen una baseline aprendida. |
list_documents | Busca cuadernos y dashboards por título. |
list_business_maps | Lista los mapas de Business Telemetry y su último veredicto. |
business_status | Evalúa un mapa y explica cada caja que no está OK. |
Skills
Skills
The same endpoint also gives your agent skills, as MCP resources it reads when it needs them:
El mismo endpoint también le da skills a tu agente, como recursos MCP que lee cuando los necesita:
- App guide — what each part of OneGlass does and where to find it.
- Guía de la app — qué hace cada parte de OneGlass y dónde encontrarla.
- RCXQL reference — syntax and query patterns.
- Referencia de RCXQL — sintaxis y patrones de consulta.
- Dashboards — how to build a dashboard, and a reference for each panel type.
- Dashboards — cómo armar un dashboard, y una referencia de cada tipo de panel.
- Topology — entities and how they relate: what runs where and what calls what.
- Topología — las entidades y cómo se relacionan: qué corre dónde y qué llama a qué.
- Read-only — no tool changes data or configuration.
- Solo lectura — ninguna tool modifica datos ni configuración.
- One workspace — the key only reaches the workspace it belongs to.
- Un solo workspace — la clave solo llega al workspace al que pertenece.
- Checked on every call — listing tools needs no key; calling one does. No key or a bad key:
401. A key withoutapi.read:403. - Verificado en cada llamada — listar las tools no pide clave; llamar a una, sí. Sin clave o con una inválida:
401. Una clave sinapi.read:403.
API keys & the REST API
Claves de API y la API REST
Everything the portal does goes through /api/* on your workspace host. Scripts and tools call it with an API key in the Authorization: Bearer <key> header.
Todo lo que hace el portal pasa por /api/* en el host de tu workspace. Los scripts y herramientas la llaman con una clave de API en el header Authorization: Bearer <clave>.
API keys
Claves de API
Keys live in Settings → API Keys. Every member can create personal keys with api.read, and rotate or delete their own keys. Admins can pick any scope and rotate or delete any key. The value is shown once, when the key is created.
Las claves están en Settings → API Keys. Cualquier miembro puede crear claves personales con api.read y rotar o borrar las suyas. Los admins pueden elegir cualquier scope y rotar o borrar cualquier clave. El valor se muestra una sola vez, al crear la clave.
| Common scope | Allows |
|---|---|
api.read | Read through the API and the MCP endpoint. |
api.write | Create, change and delete through the API (dashboards, notebooks…). |
telemetry.ingest | Send telemetry. |
| Scope habitual | Permite |
|---|---|
api.read | Leer por la API y por el endpoint MCP. |
api.write | Crear, modificar y borrar por la API (dashboards, cuadernos…). |
telemetry.ingest | Enviar telemetría. |
The scope picker lists every other scope with its description.
El selector de scopes muestra el resto, cada uno con su descripción.
OpenAPI contract
Contrato OpenAPI
The full contract is published as OpenAPI 2.0 at /api/openapi.json (no key needed). Import it into Postman, Swagger Editor or a code generator. The portal has no built-in API explorer.
El contrato completo está publicado como OpenAPI 2.0 en /api/openapi.json (no hace falta clave). Importalo en Postman, Swagger Editor o un generador de código. El portal no trae un explorador de API propio.
curl https://<your-workspace-host>/api/openapi.json -o oneglass-openapi.json
Workspaces & isolation
Workspaces y aislamiento
Each workspace (tenant) is isolated at every layer, not only by permission checks. One workspace can never read another's data.
Cada workspace (tenant) está aislado en cada capa, no solo con chequeos de permisos. Un workspace nunca puede leer los datos de otro.
| Layer | How it is isolated |
|---|---|
| Telemetry | Its own store per workspace. |
| Settings, users, rules | Its own state database per workspace. |
| Ingestion | Each key belongs to one workspace; data can't be routed to another. |
| Runtime | Its own ingest collector per workspace. |
| Capa | Cómo se aísla |
|---|---|
| Telemetría | Un almacén propio por workspace. |
| Configuración, usuarios, reglas | Una base de estado propia por workspace. |
| Ingesta | Cada clave pertenece a un workspace; los datos no se pueden rutear a otro. |
| Runtime | Un colector de ingesta propio por workspace. |
Members & roles
Miembros y roles
There are two built-in roles, admin and viewer, plus custom roles that admins create.
Hay dos roles de fábrica, admin y viewer, más los roles personalizados que crean los admins.
| Role | What it gets |
|---|---|
| admin | Everything, including Settings, Problems, Security, alert configuration and members. |
| viewer | Every page outside admin-only areas, and personal api.read keys. A viewer can also create and edit dashboards, notebooks, business maps and workflows. |
| Custom | Any mix of page permissions (logs, traces, dashboards, hosts…). Created in Settings → Roles. |
| Rol | Qué obtiene |
|---|---|
| admin | Todo, incluidos Settings, Problems, Security, la configuración de alertas y los miembros. |
| viewer | Todas las páginas fuera de las áreas solo para admins, y claves personales api.read. Un viewer también puede crear y editar dashboards, cuadernos, mapas de negocio y workflows. |
| Personalizado | Cualquier combinación de permisos de páginas (logs, traces, dashboards, hosts…) más funciones de IA. Se crea en Settings → Roles. |
Members
Miembros
In Settings → Members an admin invites someone by email and role, changes roles and removes members. The invite produces a link, shown once, that you send to the person. With SSO on, this tab is read-only: members and roles are managed in your OneGlass account.
En Settings → Members un admin invita a alguien por email y rol, cambia roles y quita miembros. La invitación genera un link, que se muestra una vez y que le mandás a la persona. Con SSO activo, esta pestaña es de solo lectura: los miembros y roles se gestionan en tu cuenta de OneGlass.
Sign-in & SSO
Inicio de sesión y SSO
- Email and password — the default sign-in. New people join through an invite link.
- Email y contraseña — el inicio de sesión por defecto. Las personas nuevas entran con un link de invitación.
- SSO over OIDC — sign in with your identity provider. It is set up by the OneGlass team; there is no SSO tab in Settings. Ask us to turn it on.
- SSO por OIDC — iniciá sesión con tu proveedor de identidad. Lo configura el equipo de OneGlass; no hay pestaña de SSO en Settings. Pedinos que lo activemos.
- Layered checks — every request is checked for a valid session or key and for its workspace; protected pages and APIs also check the role's permission.
- Controles por capas — en cada pedido se verifica que la sesión o la clave sea válida y a qué workspace pertenece; las páginas y APIs protegidas además verifican el permiso del rol.
Settings at a glance
Settings de un vistazo
Most tabs are for admins. Everyone who can open Settings sees API Keys and Preferences; Semantic conventions, Topology and Collectors & roles are readable by anyone who can see the topology. Tabs marked * appear only when the OneGlass team has activated them for your workspace. Metric cardinality and TCO Optimizer are on by default, but the team can turn them off.
La mayoría de las pestañas son para admins. Todos los que pueden abrir Settings ven API Keys y Preferences; Semantic conventions, Topology y Collectors & roles las puede leer cualquiera que vea la topología. Las pestañas con * aparecen solo cuando el equipo de OneGlass las activó en tu workspace. Cardinalidad de métricas y Optimizador TCO vienen activadas, pero el equipo las puede desactivar.
| Group | Tab | What it's for |
|---|---|---|
| Account & Access | API Keys | Create, rotate and delete API keys. |
| Members | Invite people, change roles, remove members. | |
| Roles | Create custom roles. | |
| Preferences | Turn Easy mode on or off for yourself. | |
| Data | Buckets | Storage buckets and their retention. |
| Capture Rules | Rules for what gets captured. | |
| Tag Rules | Rules that tag entities. | |
| Kubernetes posture | Unit costs and which workload checks count. | |
| Log Parsers | Log parsers for the Security view. | |
| Applications | Browser (RUM) apps and their snippet. | |
| Pipeline | Your ingest collector's config versions and routing rules. | |
| Semantic conventions | What your telemetry looks like, and mapping rules. | |
| Topology | Custom entity hierarchies. | |
| Agents | Agents | The agents sending data; register ghost senders and set per-host auto-instrumentation. |
| Collectors & roles | SNMP pollers and pools; synthetic locations. | |
| Deployment | Generate installers for collectors and agents. | |
| Hosts | Hosts that workflow HTTP steps may call. | |
| Auto-instrumentation | Zero-code instrumentation for Java, .NET, Node.js, Python and Apache (Linux hosts). | |
| Integrations | Integrations | Email, webhook and WhatsApp channels; GitHub Issues. |
| CredStore | Encrypted secrets used by other features. | |
| Alerts | Detectors | Turn detectors on or off and tune them; add your own. |
| Silences | Silence alerts by detector and scope. | |
| Tenant | Data cap * | Record a storage cap (not enforced). |
| Metric cardinality | Active series against a budget (display only). | |
| Timezone | The workspace's display timezone. | |
| TCO Optimizer | What drives ingest volume, with a suggested drop rule to copy. |
| Grupo | Pestaña | Para qué sirve |
|---|---|---|
| Cuenta y Acceso | Claves API | Crear, rotar y borrar claves de API. |
| Miembros | Invitar personas, cambiar roles, quitar miembros. | |
| Roles | Crear roles personalizados. | |
| Preferencias | Activar o desactivar el modo sencillo para vos. | |
| Datos | Buckets | Buckets de almacenamiento y su retención. |
| Reglas de captura | Reglas de qué se captura. | |
| Reglas de etiquetas | Reglas que etiquetan entidades. | |
| Postura de Kubernetes | Costos unitarios y qué chequeos de workloads cuentan. | |
| Parsers de logs | Parsers de logs para la vista Security. | |
| Aplicaciones | Apps de navegador (RUM) y su snippet. | |
| Pipeline | Versiones de config de tu colector de ingesta y reglas de ruteo. | |
| Convenciones semánticas | Cómo se ve tu telemetría, y reglas de mapeo. | |
| Topología | Jerarquías de entidades propias. | |
| Agentes | Agentes | Los agentes que envían datos; registrar emisores fantasma y configurar la autoinstrumentación por host. |
| Colectores y roles | Pollers SNMP y pools; ubicaciones sintéticas. | |
| Despliegue | Generar instaladores de colectores y agentes. | |
| Equipos | Hosts a los que pueden llamar los pasos HTTP de los workflows. | |
| Autoinstrumentación | Instrumentación sin código para Java, .NET, Node.js, Python y Apache (hosts Linux). | |
| Integraciones | Integraciones | Canales de email, webhook y WhatsApp; GitHub Issues. |
| CredStore | Secretos cifrados que usan otras funciones. | |
| Alertas | Detectores | Activar, desactivar y ajustar detectores; agregar los tuyos. |
| Silenciamientos | Silenciar alertas por detector y alcance. | |
| Tenant | Límite de datos * | Registrar un tope de almacenamiento (no se aplica). |
| Cardinalidad de métricas | Series activas contra un presupuesto (solo visualización). | |
| Zona horaria | La zona horaria de visualización del workspace. | |
| Optimizador TCO | Qué genera volumen de ingesta, con una regla de descarte sugerida para copiar. |
Easy mode
Modo sencillo
A simplified, read-only view for people who just need to know whether things are OK: status, problems in plain language, your apps, usage and a 90-day history. Each user turns it on for themselves in Settings → Preferences, and goes back with Full mode in its menu.
Una vista simplificada y de solo lectura para quien solo necesita saber si todo está bien: estado, problemas en lenguaje claro, tus apps, consumo y un historial de 90 días. Cada usuario la activa para sí mismo en Settings → Preferencias, y vuelve con Modo completo en su menú.
OneGlass on your phone
OneGlass en tu celular
A reduced OneGlass for the phone lives at /m — same login, same data, no app to install. Opening OneGlass on a phone takes you there; Profile has a link back to the full version. It opens in Spanish by default.
Un OneGlass reducido para el celular vive en /m — mismo login, mismos datos, sin app que instalar. Si abrís OneGlass en el celular te lleva ahí; en Perfil hay un link para volver a la versión completa. Abre en español por defecto.
What Pipelines is
Qué es Pipelines
OneGlass Pipelines is a separate app from the OneGlass platform. It is the control plane for your OpenTelemetry agents: they connect to it over OpAMP, report their status, and receive their configuration from it.
OneGlass Pipelines es una app separada de la plataforma OneGlass. Es el plano de control de tus agentes OpenTelemetry: se conectan a ella por OpAMP, reportan su estado y reciben su configuración desde ahí.
What it is not
Qué no es
Pipelines is not the ingestion path. Your agents send telemetry straight to their destination — OneGlass or any OTLP endpoint. Pipelines does not receive or store that data; it only manages the agents.
Pipelines no es el camino de ingesta. Tus agentes mandan la telemetría directo a su destino — OneGlass o cualquier endpoint OTLP. Pipelines no recibe ni guarda esos datos; solo gestiona los agentes.
Pipelines and the OneGlass platform
Pipelines y la plataforma OneGlass
The platform's Agents page is an inventory: you can see your agents there, but you cannot change their config, disable them or delete them. That control lives in Pipelines. From the platform page you can only register a ghost sender and set a host's auto-instrumentation.
La página Agents de la plataforma es un inventario: ahí ves tus agentes, pero no podés cambiarles la config, deshabilitarlos ni borrarlos. Ese control vive en Pipelines. Desde la plataforma solo podés registrar un emisor fantasma y definir la autoinstrumentación de un host.
The app
La app
| Page | What you do there |
|---|---|
| Overview | Fleet health at a glance and a map of how data flows from groups to destinations. |
| Throughput | Logs, metrics and traces volume over time. |
| Agents | Your fleet — see Fleet. |
| Configurations · Groups | What each agent runs — see Configuration & rollouts. |
| Install · Agent Tokens | Add agents and revoke their tokens — see Install. |
| Settings | Your sign-in password (or the break-glass password when SSO is on). |
| Página | Qué hacés ahí |
|---|---|
| Overview | La salud de la flota de un vistazo y un mapa de cómo fluyen los datos de los grupos a los destinos. |
| Throughput | Volumen de logs, métricas y traces en el tiempo. |
| Agents | Tu flota — ver Flota. |
| Configurations · Groups | Qué corre cada agente — ver Configuración y rollouts. |
| Install · Agent Tokens | Sumar agentes y revocar sus tokens — ver Instalación. |
| Settings | Tu contraseña de acceso (o la contraseña de emergencia si usás SSO). |
The OneGlass agent
El agente de OneGlass
The OneGlass agent is an OpenTelemetry Collector installed together with a supervisor that keeps it connected to Pipelines. On Linux it is OneGlass's own collector distribution; on Windows it is the upstream OpenTelemetry Collector Contrib build. Pipelines sends it its config.
El agente de OneGlass es un OpenTelemetry Collector que se instala junto con un supervisor que lo mantiene conectado a Pipelines. En Linux es la distribución propia de OneGlass; en Windows es el OpenTelemetry Collector Contrib oficial. Pipelines le manda su config.
It is optional. You can keep your own OpenTelemetry Collector and connect it to Pipelines in one of two ways:
Es opcional. Podés seguir con tu propio OpenTelemetry Collector y conectarlo a Pipelines de una de dos formas:
- Managed — your collector runs under the OpAMP supervisor and Pipelines pushes its config.
- Gestionado — tu collector corre bajo el supervisor OpAMP y Pipelines le manda la config.
- Report-only — your collector reports its health to Pipelines; Pipelines never changes its config.
- Solo reporte — tu collector le reporta su salud a Pipelines; Pipelines nunca le cambia la config.
Where to install
Dónde instalar
Agents are added from the Install page in Pipelines (pipelines.oneglass.io). It covers the OneGlass agent on Linux and Windows, and both ways of connecting your own collector. After you download the OneGlass agent installer, the page shows each new agent as it connects.
Los agentes se suman desde la página Install de Pipelines (pipelines.oneglass.io). Cubre el agente de OneGlass en Linux y Windows, y las dos formas de conectar tu propio collector. Después de descargar el instalador del agente de OneGlass, la página muestra cada agente nuevo a medida que se conecta.
When you download the OneGlass agent installer you can add labels (key=value) — groups use them to pick agents.
For every delivery mode you choose the destination: OneGlass or any OTLP endpoint, set now or supplied at run time through environment variables.
Al descargar el instalador del agente de OneGlass podés agregar labels (clave=valor) — los grupos los usan para elegir
agentes. En todos los modos elegís el destino: OneGlass o cualquier endpoint OTLP, definido ahora o pasado en tiempo de ejecución por variables de entorno.
Fleet
Flota
The Agents page lists every agent live, with its status, version, host, throughput, queue and config drift. Open one to see its rates, queue, drops, memory, labels and the config it is running.
La página Agents lista cada agente en vivo, con su estado, versión, host, throughput, cola y drift de config. Abrí uno para ver sus tasas, cola, descartes, memoria, labels y la config que está corriendo.
- Disable / enable an agent, or delete it (with confirmation).
- Deshabilitar / habilitar un agente, o borrarlo (con confirmación).
- Versions are shown and filterable. Pipelines does not upgrade agents remotely.
- Las versiones se muestran y se pueden filtrar. Pipelines no actualiza agentes de forma remota.
Drift
Drift
| State | Meaning |
|---|---|
| IN-SYNC | Running the config Pipelines composed for it. |
| PENDING | Change in flight. Not a fault. |
| DRIFTED | Running something other than its composed config. |
| FAILED | The agent reported it could not apply its config. |
| PINNED | Rolled back to its last good config after repeated failed applies. Fix the group or baseline to clear it. |
| UNMANAGED | Report-only collector: Pipelines never pushes it config. |
| Estado | Significado |
|---|---|
| IN-SYNC | Corre la config que Pipelines armó para él. |
| PENDING | Cambio en curso. No es una falla. |
| DRIFTED | Corre algo distinto de la config que se le armó. |
| FAILED | El agente reportó que no pudo aplicar su config. |
| PINNED | Volvió a su última config buena después de varios intentos fallidos. Corregí el grupo o la baseline para liberarlo. |
| UNMANAGED | Collector de solo reporte: Pipelines nunca le manda config. |
Groups & labels
Grupos y labels
A group picks agents by label and adds config on top of the workspace baseline; groups apply in priority order. Before saving, preview how many agents match. You can also override an agent's labels, or create a group scoped to a single agent.
Un grupo elige agentes por label y suma config encima de la baseline del workspace; los grupos se aplican por orden de prioridad. Antes de guardar, previsualizá cuántos agentes coinciden. También podés sobrescribir los labels de un agente o crear un grupo acotado a un solo agente.
Configuration & rollouts
Configuración y rollouts
In Configurations you edit a collector config as YAML or in the visual builder (sources → processors → destinations), and switch between the two. You can check a config before saving: Lint it, or Validate it against the real collector binary. Save does not run the check for you.
En Configurations editás una config de collector en YAML o en el editor visual (sources → processors → destinations), y pasás de uno al otro. Podés verificar una config antes de guardar: con Lint, o con Validate contra el binario real del collector. Guardar no la verifica por vos.
Every save is a new version. When you edit an existing config you see a diff of your changes before it is stored, and older versions stay available.
Cada guardado es una versión nueva. Cuando editás una config existente ves un diff de tus cambios antes de que se guarde, y las versiones anteriores siguen disponibles.
Canary rollouts
Rollouts canary
Roll a change to the baseline or a group out to a share of agents first (1–99%) and watch that cohort's health.
Desplegá un cambio de la baseline o de un grupo primero a una parte de los agentes (1–99%) y mirá la salud de esa cohorte.
- Promote — send it to everyone.
- Promote — mandarlo a todos.
- Abort — stop it. A rollout also aborts on its own if too many canary agents fail.
- Abort — frenarlo. Un rollout también se aborta solo si fallan demasiados agentes canary.
- Restore — undo a promoted rollout and bring back the previous config.
- Restore — deshacer un rollout promovido y volver a la config anterior.