Observability that thinks.Observabilidad que piensa.
Your crystal ball for production. OneGlass reads every log, trace and metric, sees trouble coming, and explains it — to your team and to your AI agents.Tu bola de cristal para producción. OneGlass lee cada log, traza y métrica, ve venir los problemas y los explica — a tu equipo y a tus agentes de IA.
7 days in a workspace of your own7 días en un workspace propio
Built on OpenTelemetry, OTLP and OpAMP. Send with standard OpenTelemetry — no proprietary agent required, no lock‑in.Construido sobre OpenTelemetry, OTLP y OpAMP. Enviá con OpenTelemetry estándar — no hace falta un agente propietario, sin lock‑in.

See the business. Make sense of the telemetry.Mirá el negocio. Dale sentido a la telemetría.
Tell an agent your flow — sign-up, cart, checkout, payment — and it builds the map for you through the API. Every step lights up green, yellow or red from live data, and any agent can ask “is checkout OK?” and get the answer in words.Contale tu flujo a un agente — alta, carrito, checkout, pago — y te arma el mapa por la API. Cada paso se enciende en verde, amarillo o rojo con datos en vivo, y cualquier agente puede preguntar “¿checkout está bien?” y recibir la respuesta en palabras.
All the context, ready for your model.Todo el contexto, listo para tu modelo.
OneGlass is for humans and agents. Connect any MCP client — Claude, Cursor or your own agents — and production arrives already correlated: incidents, problems, service health, entity lookup, log patterns, Kubernetes events, recent changes and RCXQL as tools, next to whatever tooling you already use.OneGlass es para humanos y agentes. Conectá cualquier cliente MCP — Claude, Cursor o tus propios agentes — y producción llega ya correlacionada: incidentes, problemas, salud de servicios, búsqueda de entidades, patrones de logs, eventos de Kubernetes, cambios recientes y RCXQL como herramientas, junto al tooling que ya usás.
list_problemsget_problemexecute_rcxqlservice_healthrecent_changesk8s_eventslog_pattern- And watch your own agents: model calls, tools and tokens from GenAI spansY mirá a tus propios agentes: llamadas al modelo, herramientas y tokens desde spans GenAI
- Skills over MCP: the app guide and RCXQL, dashboard and topology referencesSkills por MCP: la guía de la app y las referencias de RCXQL, dashboards y topología
OneGlass. Three ways to look through it.OneGlass. Tres formas de mirar a través.
Know what broke, first.Sabé qué se rompió, primero.
One problem instead of an alert storm, with the cause written down.Un problema en lugar de una tormenta de alertas, con la causa escrita.
- Problems grouped by causalityProblemas agrupados por causalidad
- Root-cause tree with a confidence scoreÁrbol de causa raíz con puntaje de confianza
- 50+ built-in detectorsMás de 50 detectores incluidos
- Topology and resilienceTopología y resiliencia
Debug with the whole picture.Depurá con el cuadro completo.
From a slow request to the span, the log line and the deploy behind it.De un request lento al span, la línea de log y el deploy que hay detrás.
- End-to-end tracesTrazas de punta a punta
- Log patternsPatrones de logs
- RCXQL, or plain SQLRCXQL, o SQL
- Real user monitoringMonitoreo de usuarios reales
Give your agents eyes.Dale ojos a tus agentes.
Your agents read production through MCP, and the AI agents view shows your own agents’ model and tool calls from their GenAI spans.Tus agentes leen producción por MCP, y la vista de agentes de IA muestra las llamadas al modelo y a herramientas de tus propios agentes desde sus spans GenAI.
- MCP server for your agentsServidor MCP para tus agentes
- GenAI span observabilityObservabilidad de spans GenAI
- Skills for RCXQL, dashboards and topologySkills de RCXQL, dashboards y topología
- Automations on problemsAutomatizaciones ante problemas
Agents act. OneGlass explains.Los agentes actúan. OneGlass explica.
Deploys, autoscalers, AI agents — production changes faster than anyone can watch. OneGlass connects every signal, groups what broke into one problem and writes down why.Deploys, autoscalers, agentes de IA — producción cambia más rápido de lo que alguien puede mirar. OneGlass conecta cada señal, agrupa lo que se rompió en un problema y escribe por qué.
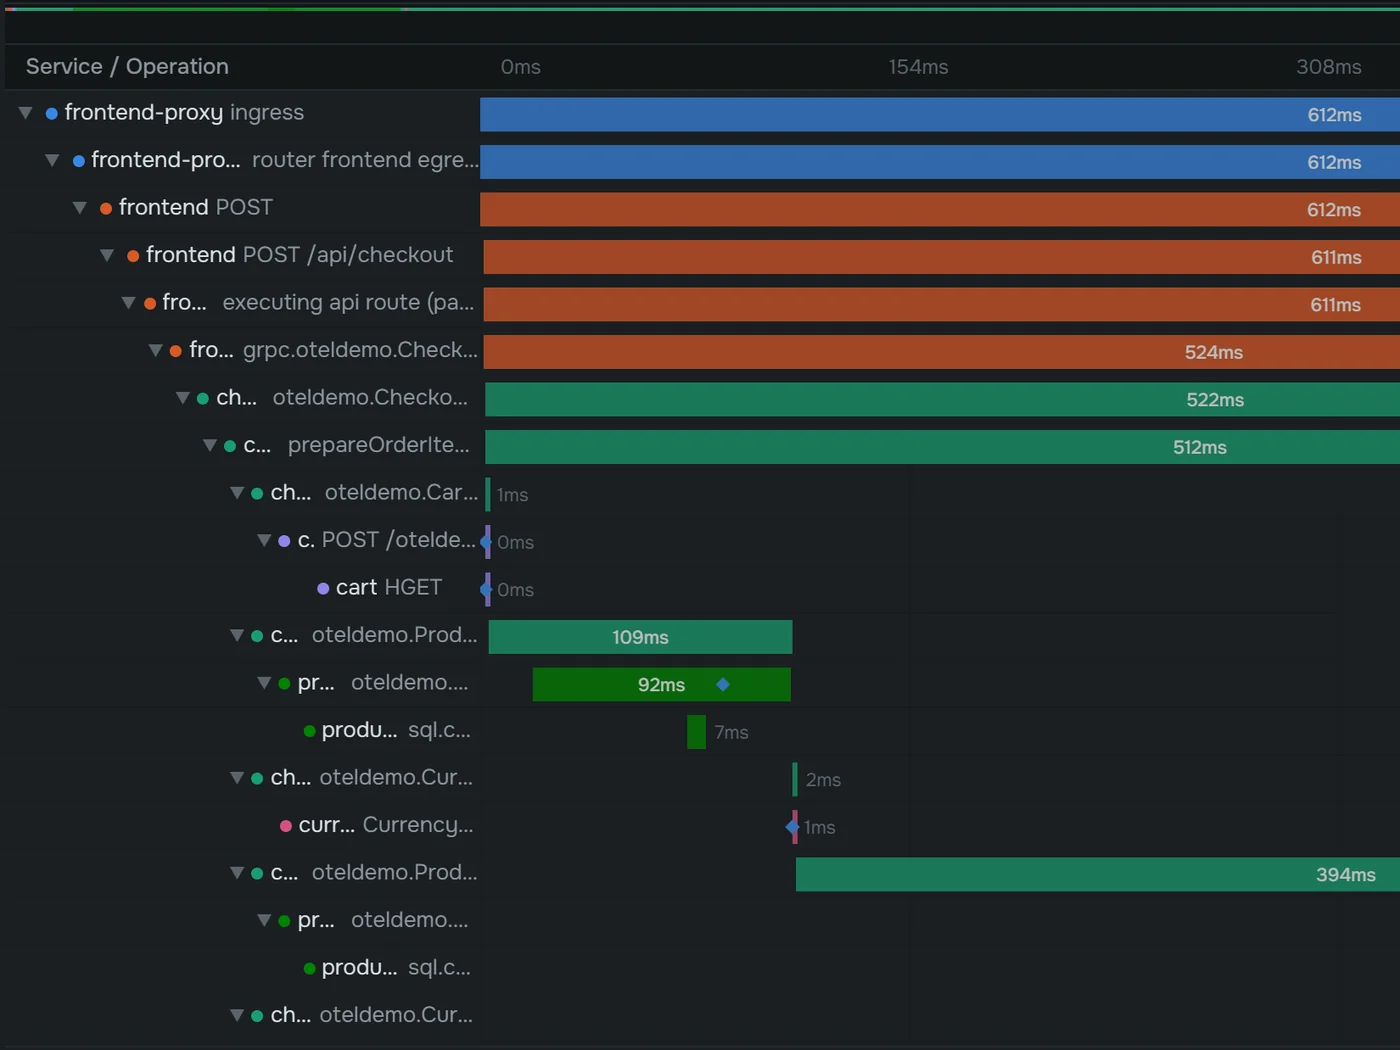
Follow one request through every serviceSeguí un request por cada servicio
A checkout crossing 11 services, every span on one waterfall — then straight to its logs.Un checkout que cruza 11 servicios, cada span en una cascada — y de ahí directo a sus logs.
Fifty alerts. One problem.Cincuenta alertas. Un problema.
Related incidents fold into one problem along the topology, with the likely cause and the evidence behind it.Los incidentes relacionados se agrupan en un problema sobre la topología, con la causa probable y la evidencia que la respalda.
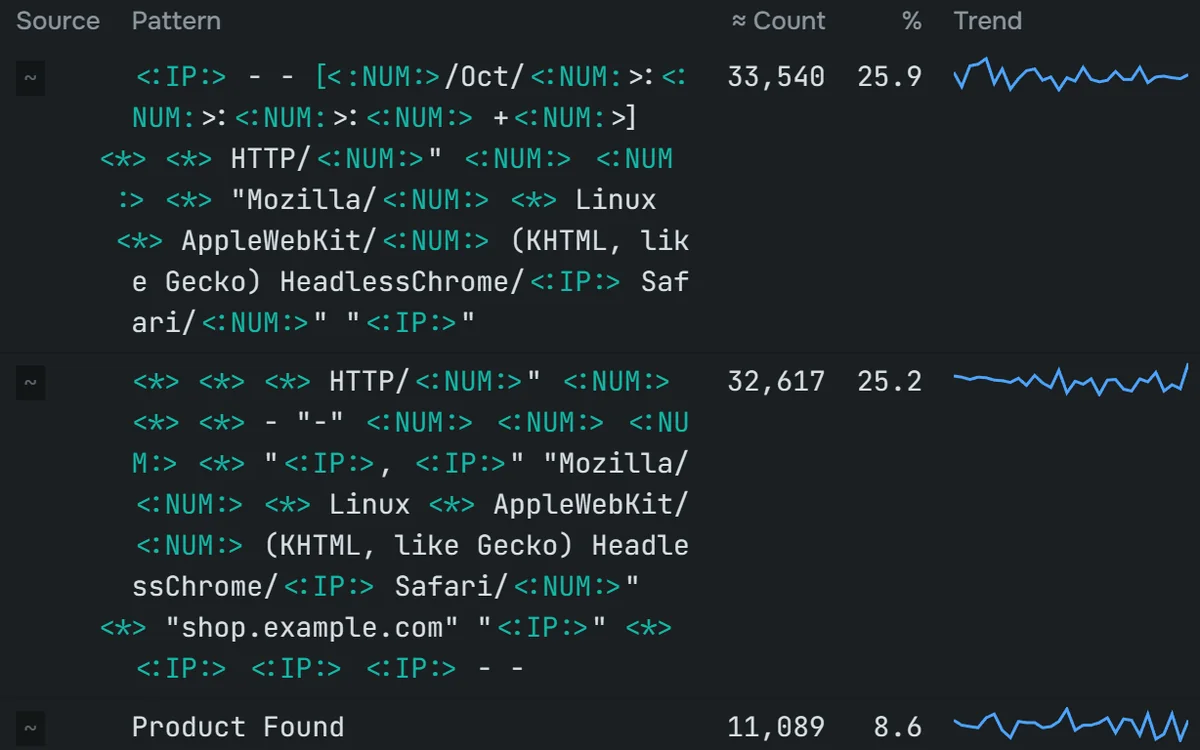
Logs, as patternsLogs, como patrones
Millions of lines become a few hundred patterns, each with its count and trend.Millones de líneas se vuelven unos pocos cientos de patrones, cada uno con su cantidad y tendencia.
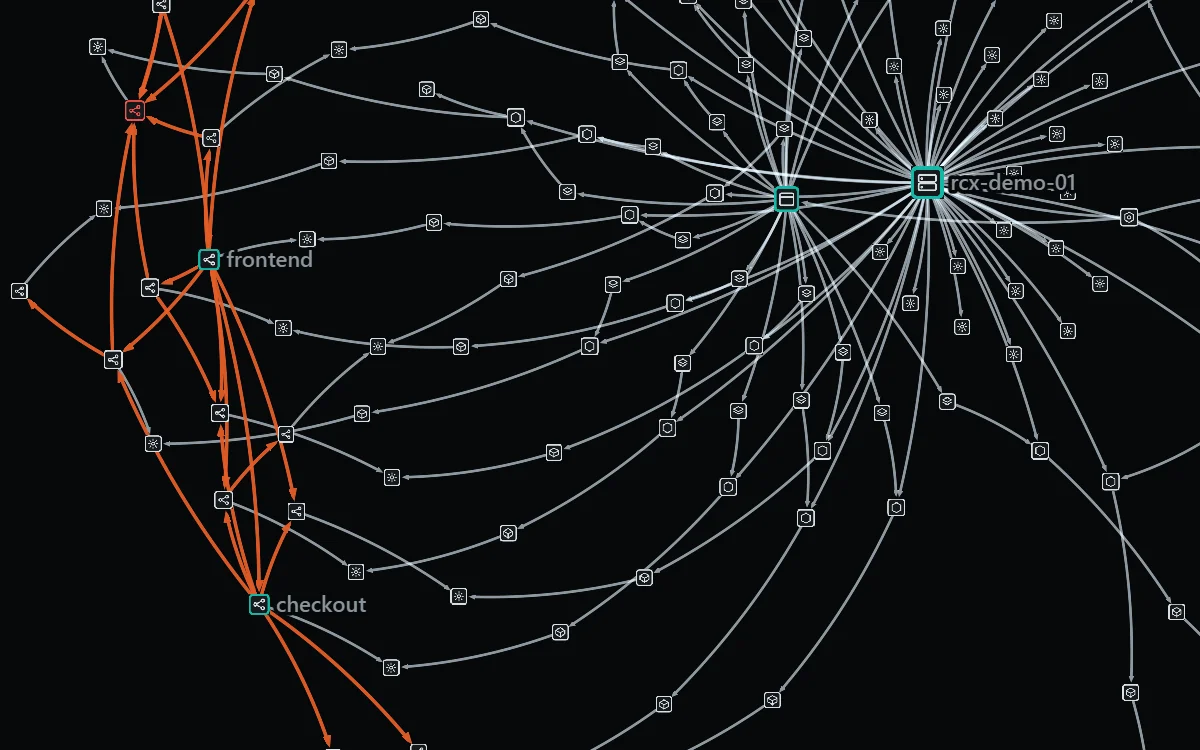
A map that draws itselfUn mapa que se dibuja solo
Hosts, Kubernetes, VMs, processes and service calls — discovered automatically, with history to see what changed.Hosts, Kubernetes, VMs, procesos y llamadas entre servicios — descubiertos solos, con historial para ver qué cambió.
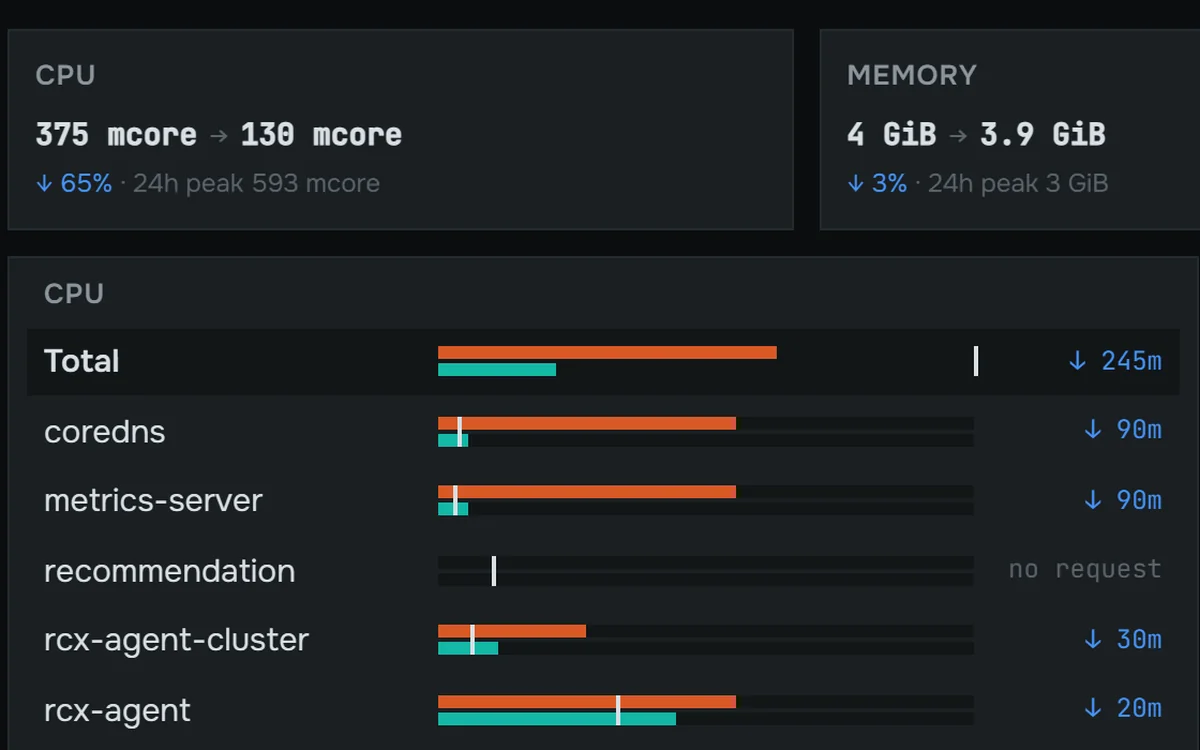
See what your clusters really use — and optimize it.Mirá lo que tus clusters usan de verdad — y optimizalo.
Every workload’s reservation next to its real 24-hour peak, with a suggested right-size for each.La reserva de cada workload al lado de su pico real de 24 horas, con un ajuste sugerido para cada uno.
- CPU and memory, per workloadCPU y memoria, por workload
- Cluster, node and namespace healthSalud de clusters, nodos y namespaces
- A suggested change for every workloadUn cambio sugerido para cada workload
RCXQL. And SQL, too.RCXQL. Y también SQL.
One piped language for logs, traces, metrics and topology. Prefer SQL? Write it — OneGlass translates it to RCXQL as you type, so nobody has to learn anything to start.Un lenguaje piped para logs, trazas, métricas y topología. ¿Preferís SQL? Escribilo — OneGlass lo traduce a RCXQL mientras tipeás, así nadie tiene que aprender nada para empezar.
SELECT SeverityText, count(*) AS n
FROM logs
WHERE timestamp > now() - INTERVAL 1 HOUR
GROUP BY SeverityText ORDER BY n DESC
get logs, from: -1h
| summarize n = count(), by: {SeverityText}
| sort n desc
Everything else, in the box.Todo lo demás, incluido.
Real user monitoringUsuarios reales
Web Vitals, errors and session replay.Web Vitals, errores y replay de sesiones.
Synthetics
HTTP, TCP, TLS and real-browser journeys.HTTP, TCP, TLS y recorridos en navegador real.
Hosts & containersHosts y contenedores
CPU, memory, disk and network per host; CPU, memory and disk per process.CPU, memoria, disco y red por host; CPU, memoria y disco por proceso.
Network & HypervisorsRed e hipervisores
SNMP devices, ports, vCenters and VMs.Equipos SNMP, puertos, vCenters y VMs.
AI agentsAgentes de IA
Model calls, tools and tokens from GenAI spans.Llamadas al modelo, herramientas y tokens desde spans GenAI.
Dashboards
26 chart types plus canvas, text and business-map panels; public links.26 tipos de gráfico más paneles canvas, de texto y de mapas de negocio; links públicos.
AutomationsAutomatizaciones
Workflows triggered by webhooks or problems.Flujos disparados por webhooks o problemas.
MCP & SkillsMCP y Skills
Plug in your own agents, with the context and skills ready.Conectá tus propios agentes, con el contexto y las skills listos.
Pipelines
Collect, transform and route — fleet over OpAMP.Recolectar, transformar y enrutar — flota vía OpAMP.
QuestionsPreguntas
Do I need a proprietary agent or SDK?¿Necesito un agente o SDK propietario?
Not required. Point your existing OpenTelemetry Collector or any OTel SDK at OneGlass — or install the OneGlass agent with one line if you want us to manage it.No hace falta. Apuntá tu OpenTelemetry Collector actual, o cualquier SDK OTel, a OneGlass — o instalá el agente de OneGlass con una línea si querés que lo gestionemos nosotros.
What do I get in the trial?¿Qué incluye la prueba?
A real workspace of your own, for 7 days. The link and a one-time password arrive by email, usually within minutes. Trial seats are limited. AI features and problem grouping are enabled per workspace.Un workspace real y propio, por 7 días. El link y una contraseña de un solo uso llegan por email, normalmente en minutos. Los cupos son limitados. Las funciones de IA y la agrupación en problemas se activan por workspace.
What happens when it ends?¿Qué pasa cuando termina?
We email you a day before it ends; then the workspace pauses.Te avisamos por email un día antes de que termine; después el workspace se pausa.
How do my AI agents connect?¿Cómo se conectan mis agentes de IA?
Through the OneGlass MCP server: point any MCP-capable agent at your workspace with an API key, and it can call incidents, problems, service health, log patterns and RCXQL as tools.Con el servidor MCP de OneGlass: apuntá cualquier agente compatible con MCP a tu workspace con una API key, y puede llamar incidentes, problemas, salud de servicios, patrones de logs y RCXQL como herramientas.
Can I use my own AI model?¿Puedo usar mi propio modelo de IA?
Yes. Bring the agent and the model you want and connect it to OneGlass over MCP.Sí. Traé el agente y el modelo que quieras y conectalo a OneGlass por MCP.
Can I run just the pipeline?¿Puedo usar solo el pipeline?
Yes. OneGlass Pipelines works on its own and sends to OneGlass or another OTLP endpoint.Sí. OneGlass Pipelines funciona por su cuenta y envía a OneGlass o a otro endpoint OTLP.